The Final Model
The 2016 Industrial Energy Autonomy Calculator is available for download here.
The Operating Logic
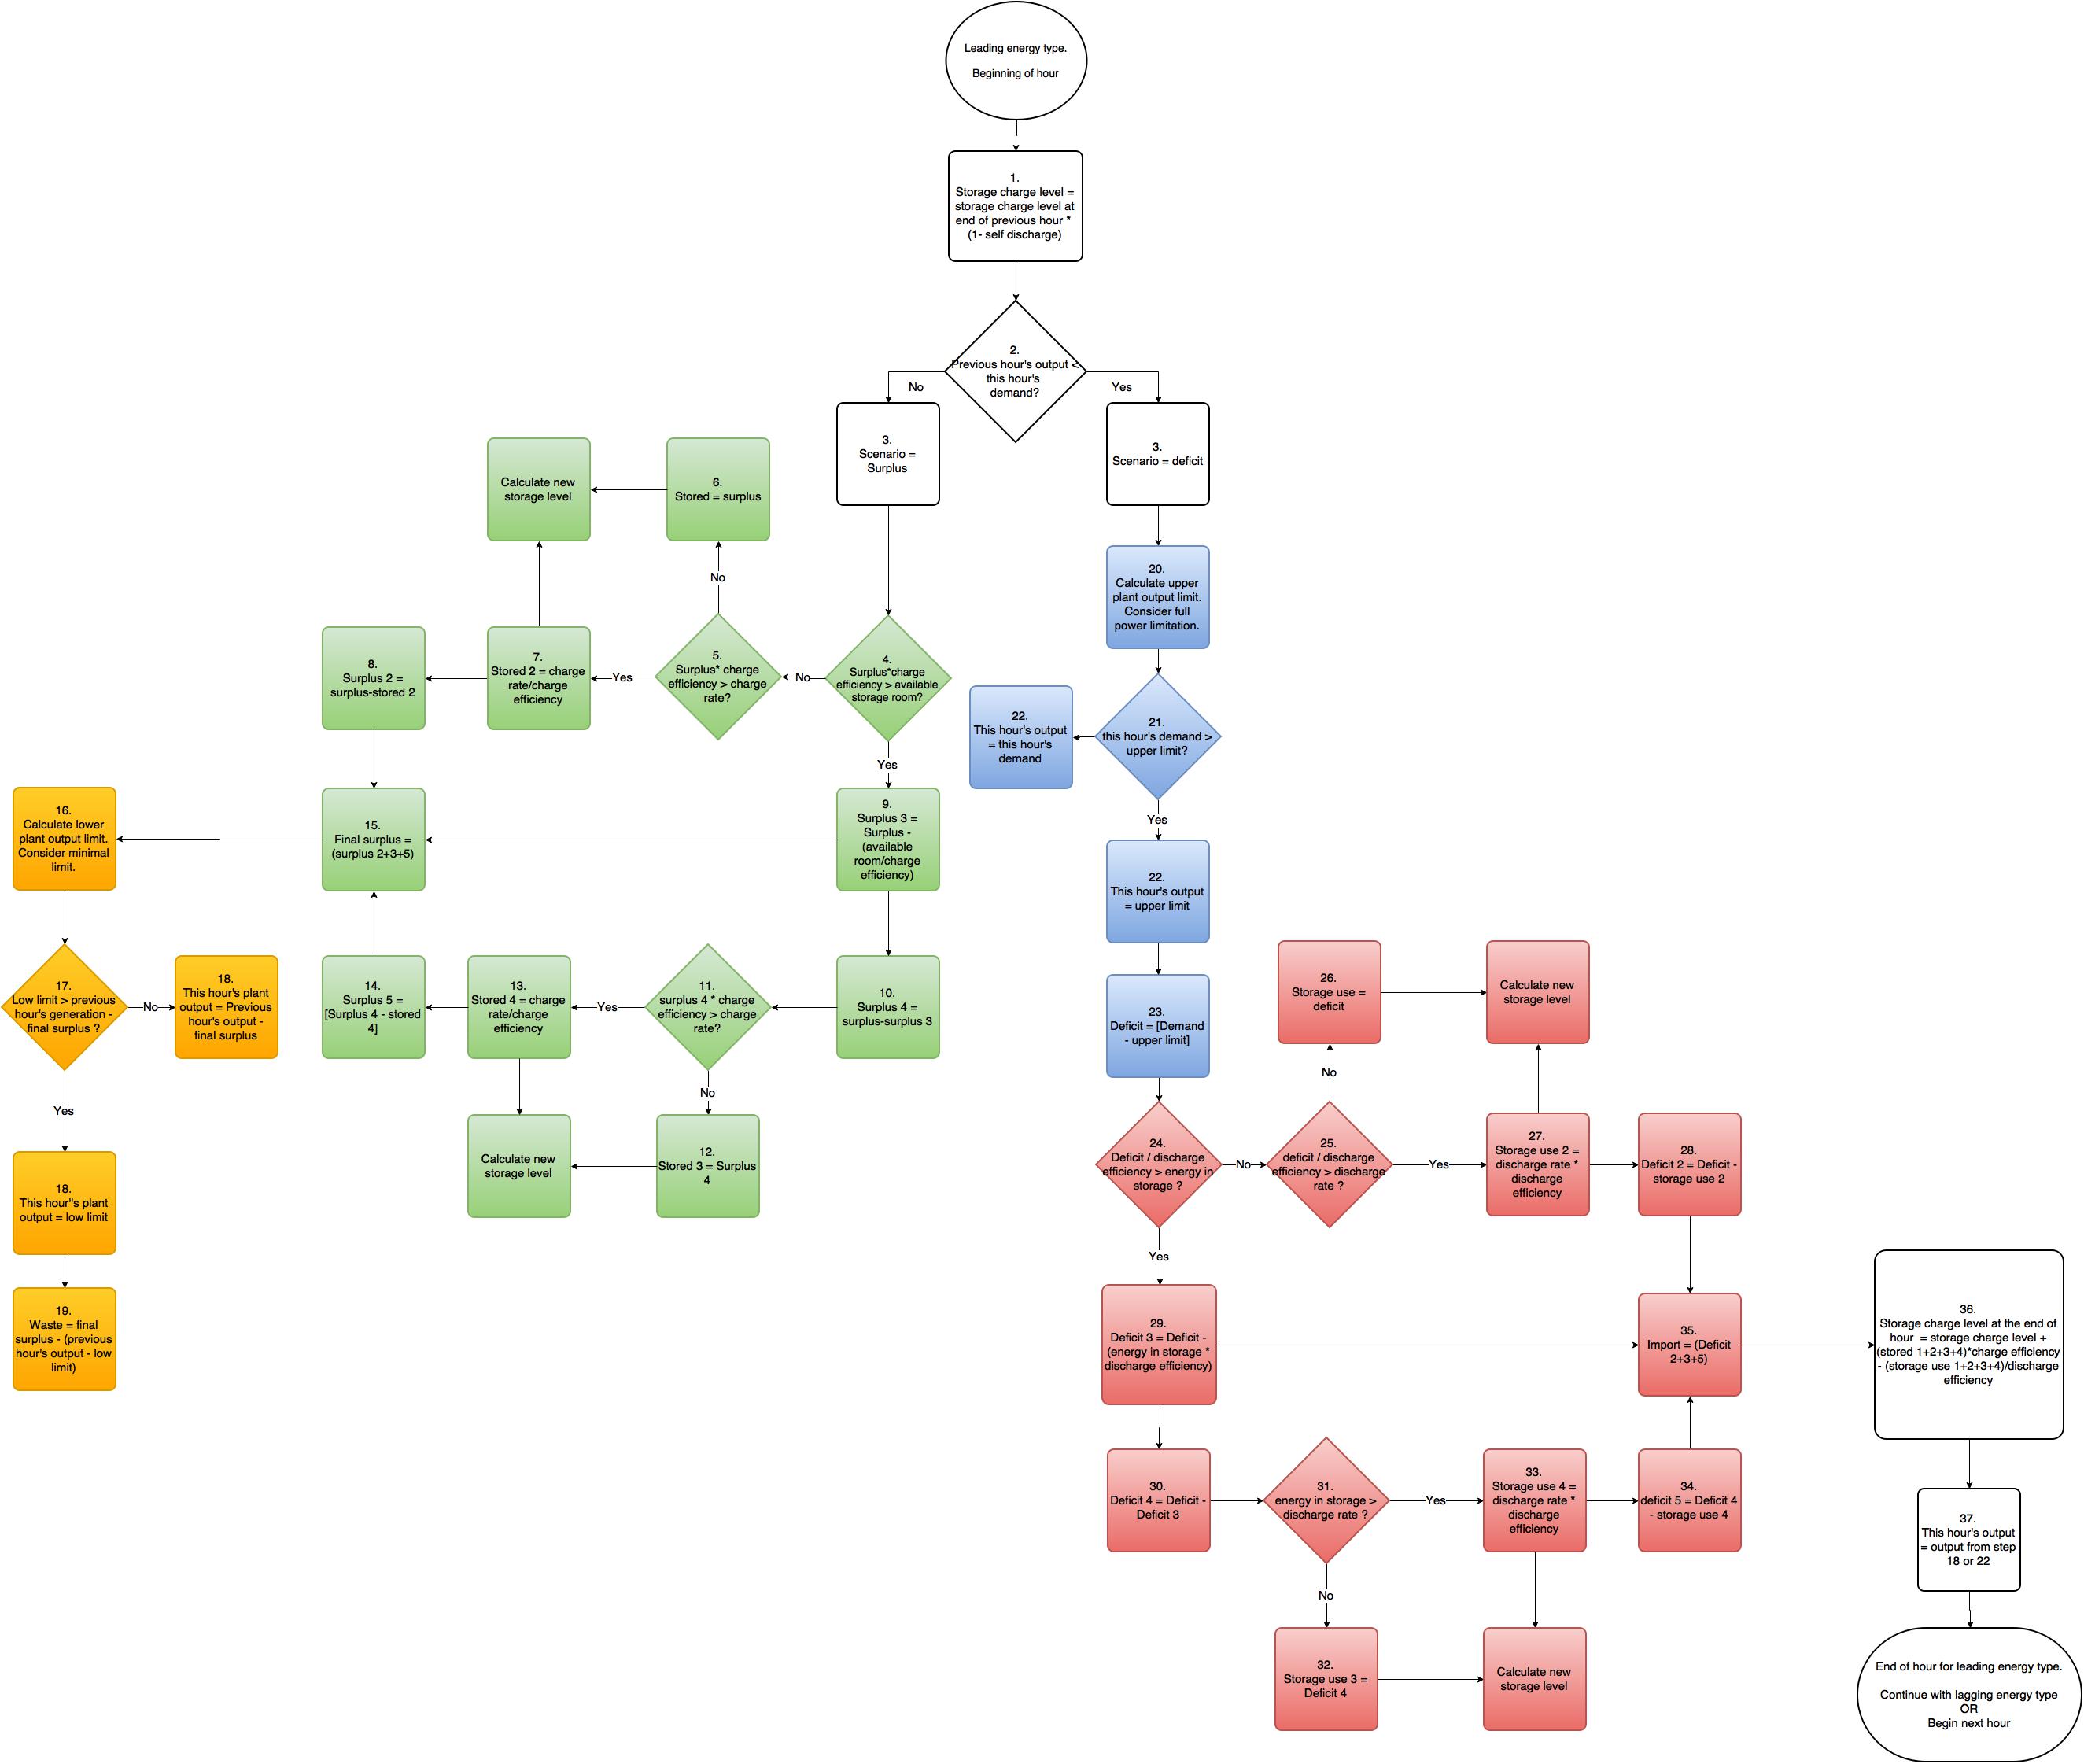
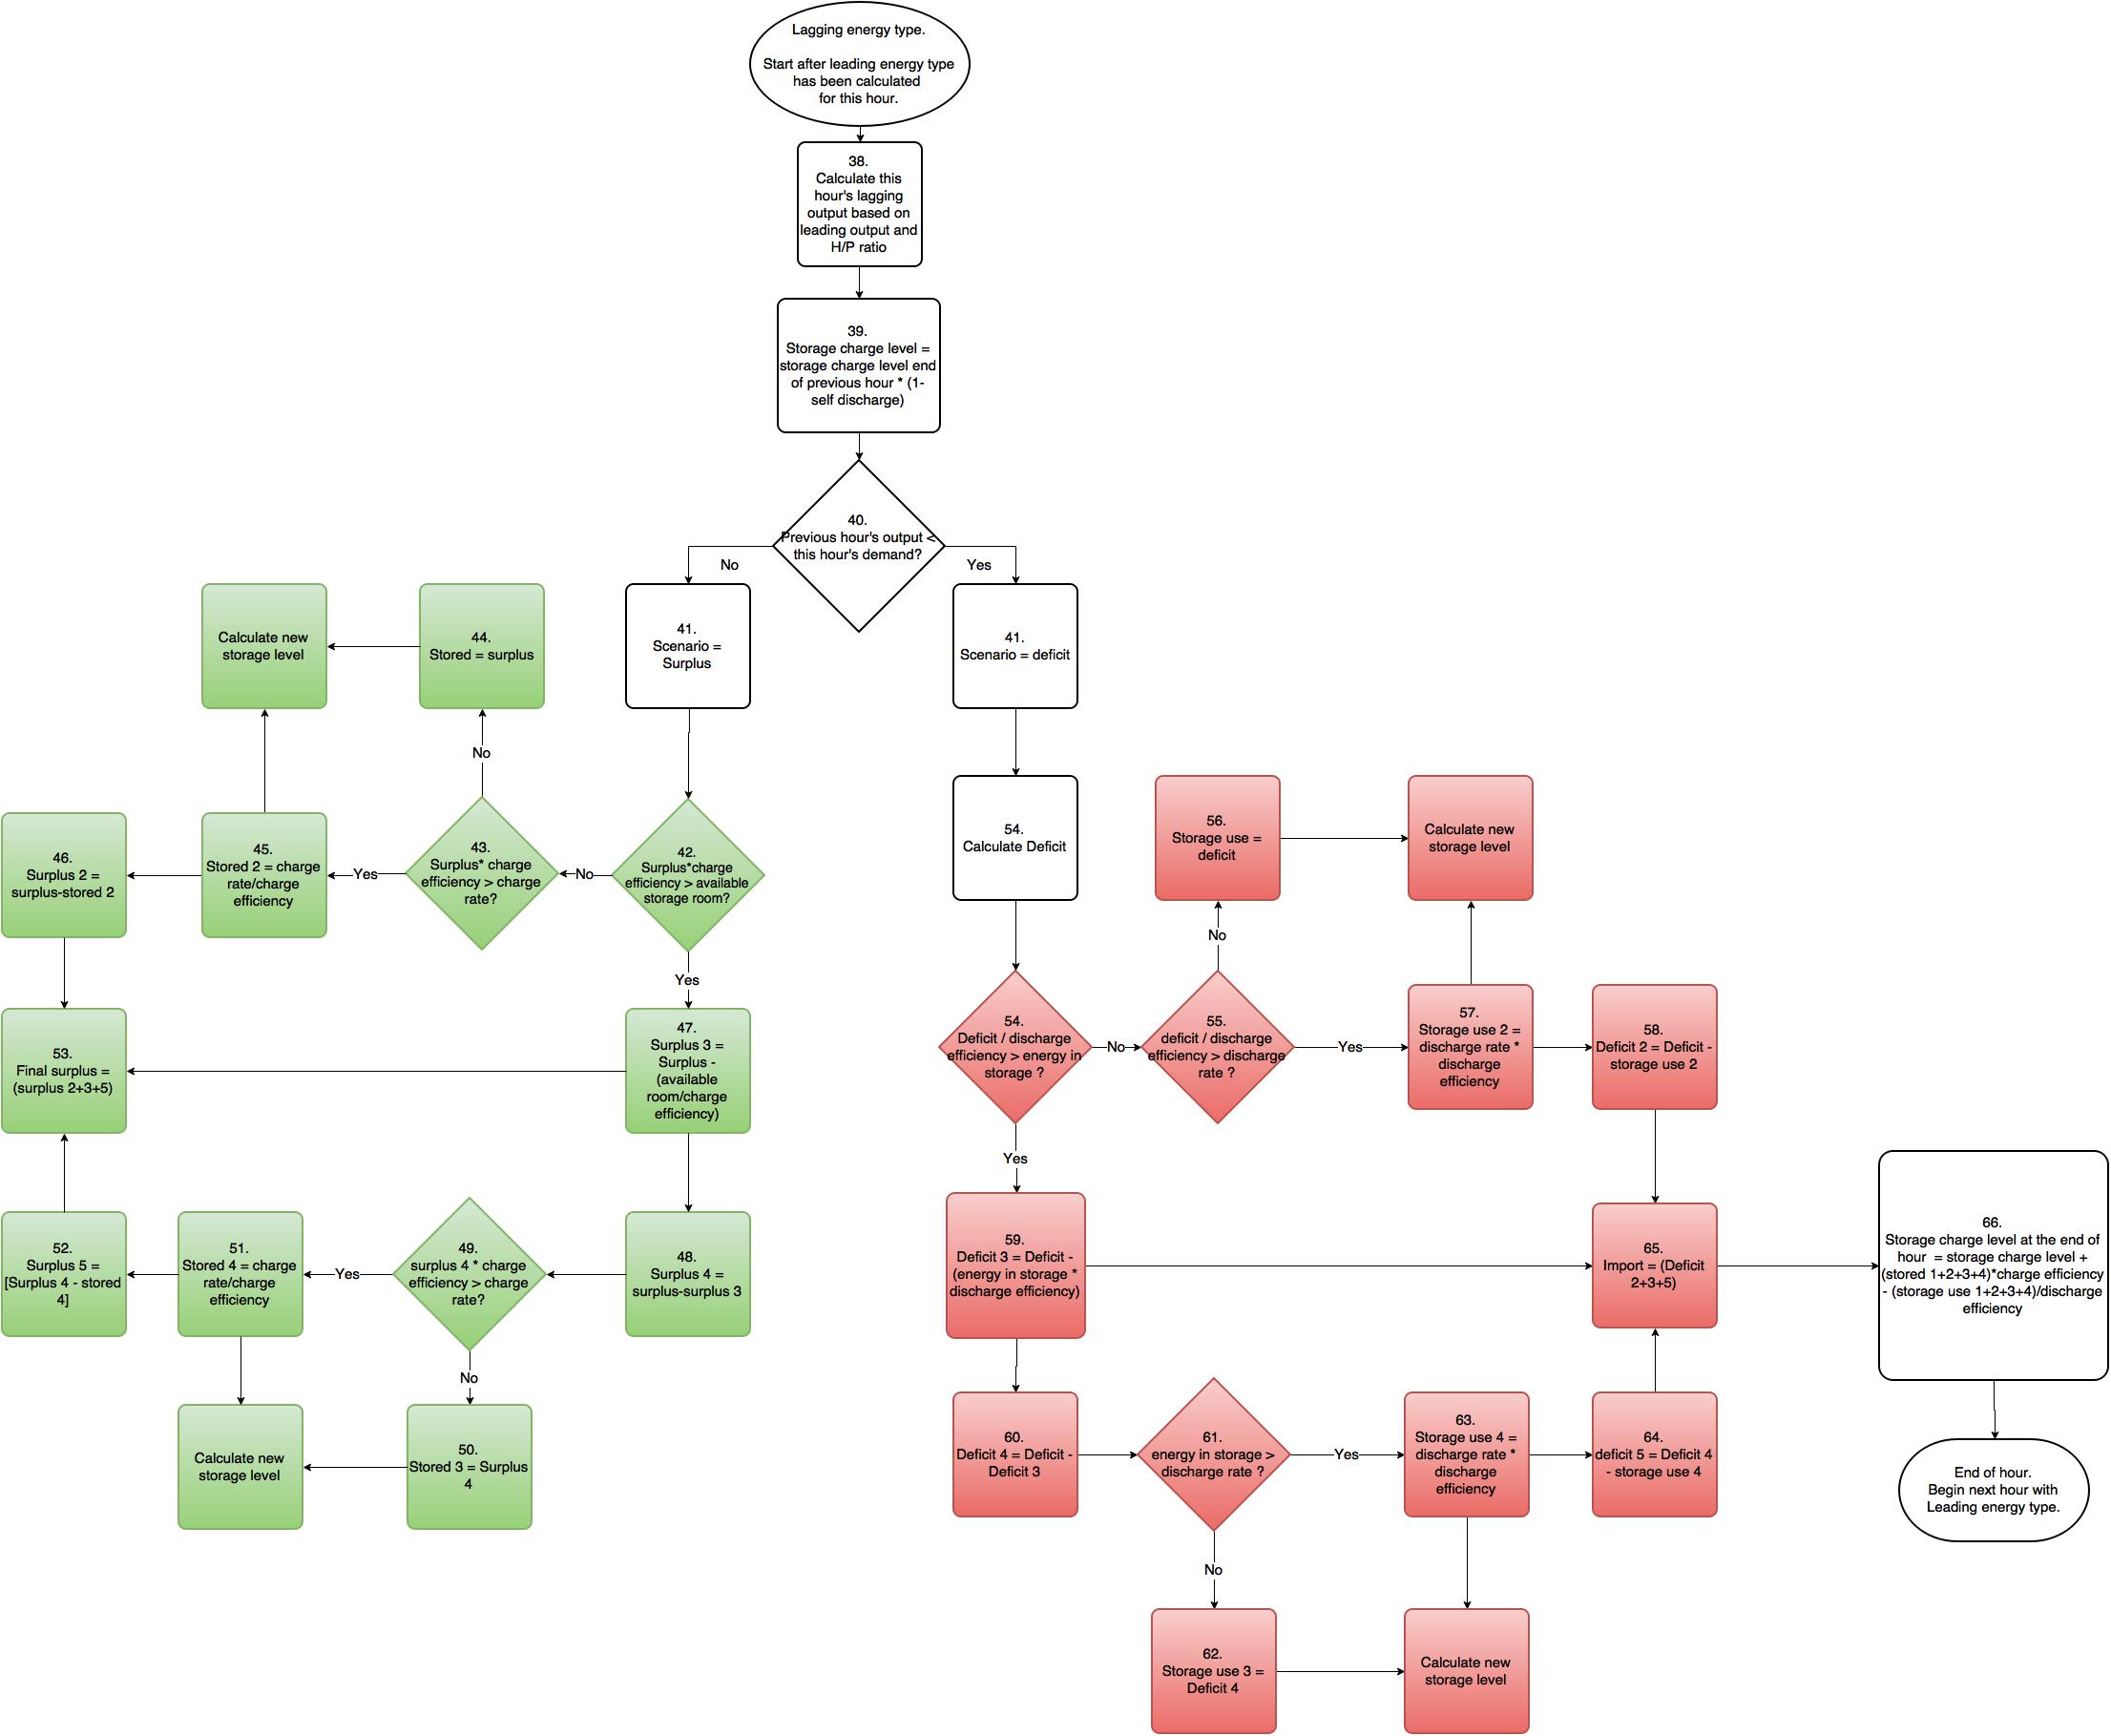
There are two different logical flow diagrams to represent the leading and lagging energy types provided by a CHP plant. The principal difference between these is that plant output is modulated according to leading energy type demand, while the lagging energy type is a byproduct and cannot be independently regulated.
In the beginning of each hour, the model accounts for losses from energy storage due to self discharge to determine the amount of stored energy available during that hour. Next, one of two operating modes is chosen for the hour, determined by comparing demand and supply (plant output in the beginning of the hour, before modulation):
• When output exceeds demand, “surplus” mode is chosen:
o The leading side first attempts to fully charge the storage using surplus (green node); only after storing as much as possible, it can ramp down the plant to avoid generating excess energy (yellow node). If there is still excess, it is exported or wasted.
o The lagging side attempts to store as much energy as possible (green node). Since no regulation is available and output of the lagging side depends on output on the leading side, if there is any energy that cannot be stored, it is either exported or wasted.
• When demand exceeds output, “deficit” mode is chosen:
o The leading side first attempts to ramp up the plant (blue node) to avoid using stored energy unnecessarily. Energy is taken from storage only when the plant is unable to supply enough energy (red node). If storage is also unable to provide the necessary energy, it is imported or marked as deficit.
o The lagging side attempts to take energy from storage (red node). If storage is unable to provide the necessary energy, it is imported or marked as deficit.
Both leading and lagging operating modes are outlined in the flow diagrams below:
The detailed way these decisions are made can be seen in the full flow diagrams (Full Leading Diagram, Full Lagging Diagram), where the different functional modules follow the same colour codes as the nodes here. The full flow diagrams also show how the hourly outputs are calculated based on these decisions.
The Four Scenarios
In addition to the above, it was found that a CHP plant can be operated in several ways, which can provide very different results. Therefore three of the most common were built into the model as standard. A fourth scenario, separate heat and power generation instead of CHP, was added as a baseline.
The operating principles of the four scenarios are shown below:
Scenario 1 represents a heat leading CHP plant. Plant output follows heat demand; power is generated in the process, but it is considered a byproduct and power output is not directly regulated.
Scenario 2, power leading CHP, is the opposite of the first: power output is regulated and heat is a byproduct.
Scenario 3, power leading with extra heat, follows the same logic as scenario 2. In this case, however, when the amount of heat generated as a byproduct of power production is not sufficient, the plant can burn more fuel specifically to supply heat. This results in a variable heat to power ratio, making scenario 3 the most realistic representation of a large-scale biomass CHP in the model. For example, a Rankine cycle with the option to bleed steam before the turbine for heating use would be operated like this. In addition, many CHP boilers and even turbines can operate temporarily at a load exceeding their rated output.
The aim of scenario 3 is to achieve maximum fuel efficiency. In any plant, more fuel needs to be used to generate a unit of power than to generate a unit of heat. So it is reasonable to generate only as much power as necessary, and to avoid generating surplus. Scenario 3 does just that; in case of heat shortage, it is easy and efficient to generate more using the existing plant. On the other hand, generating extra electricity without significant amounts of extra heat is impossible. Therefore there is no “heat leading with extra power” scenario.
Scenario 4 is the baseline scenario where heat and power are generated by separate plants. This project is concerned with biomass as an energy source and autonomy as the aim for on-site generation; consequently, the baseline was meant to represent two separate on-site biomass plants. However, the calculator allows to specify a different fuel for each of these generators. For example, a gas turbine and gas boiler is a common choice in industry and a valid baseline to compare against. To achieve an even more universal baseline, where all power is imported, it is just necessary to change baseline generator capacity to zero.
As seen on the schematic, all scenarios are calculated in units of energy – energy generated, energy stored, energy wasted, etc – in kWh during each 1-hour timestep. Then a summary is created of energy flows of all timesteps over a year. In scenario 3, the extra heat is also added as a summary figure. The number of hours of autonomous operation is counted. Finally, fuel use, emissions and cost calculations are carried out based on summary figures.