ESP-r - Graham Hills Building
Why the Graham Hills building?
The model of a floor in the Graham Hills building was selected based on the following criteria:
• Homogeneous zoning: the upper levels of the Graham Hills building have a repetitive room use and heating pattern. This means that a single zone model of one of the upper floors can give a reasonable approximation at what energy that floor actually consumes.
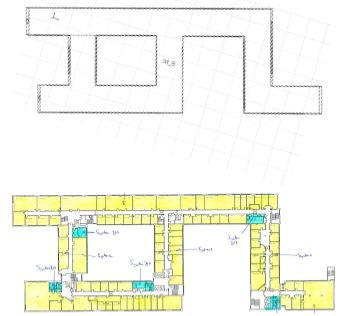
• Building drawings: to scale floor plans were provided by University of Strathclyde Estates Department (UoSED) so a geometrically accurate model could be built in ESP-r.
• Building data: Energy Performance Certificate (EPC) data and meter readings were provided by UoSED so that the model outputs could be given some context. This aids in validating any assumptions made and helps with model calibration.
• Poor performer: the Graham Hills building is old and is in need of refitting to improve thermal performance. Whether any refitting measures would be cost effective will be investigated through analysing simulation outputs and comparisons with literature.
Model geometry
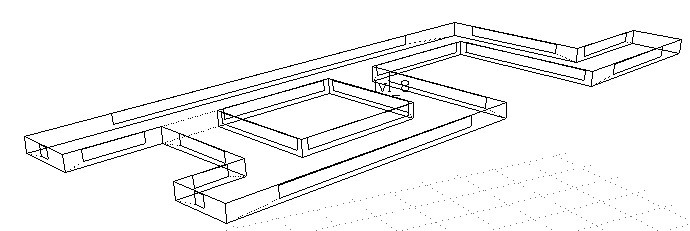
The model was built to have the same volume, floor area, wall area and glazing area as a single floor in the Graham Hills building. See below for graphical representations of the ESP-r model, in an isometric view (Figure a) and compared with the floor plan provided by the UoSED (Figure b).
Simulation results
The base case model heating energy (kWh/m2) was within 60% of the measured Key Performance Indicator (KPI) Electricity Performance Indicator (EPI) and within 40% of the Energy Performance Certificate (EPC) extended data provided by UoSED, as indicated by Table a. This indicates that the model is providing a reasonable approximation of energy use within the building.
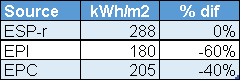
The discrepancies between the figures could be due to the simplified nature of the single zone model or mistaken assumptions regarding heating control strategies, casual gains schedules or magnitudes or building air tightness.
Single Upgrades
To understand the impact individual measures can have on this building the simulation was run with the modifications shown in Figure a. As is clear from the figure, different energy saving measures offer different savings potentials. The changes are consistent with the simulation results from the Livingstone Tower model.
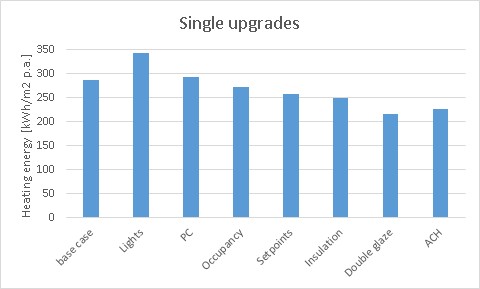
Upgrading fabric
As is to be expected, upgrading building fabric (through glazing improvements or insulating walls) improves the overall thermal performance of the building. This reduces both the magnitude and duration of heat energy supplied to the zone.
Figure c.3 shows that there is less cool down overnight in the zone with morning temperatures already at the daytime set point of 20OC. This drops as infiltration increases for the occupants at 0900 at which point the heating starts. However, heating is needed for a much shorter duration during the day due to the reduced heat losses through the fabric.
Changes in casual heat gains
In the case of changing lighting, switching PCs off at night and increasing occupancy levels these effectively mean a change in the casual heat gains throughout the day to the zone. The former two measures remove heat from the zone (hence the increase in heating load as seen in Figure c) while the latter measure increases heat input to the zone (for a decrease in heating loads).
For example, in the case of switching to LED lighting, sensible heating gains lower from 14 W/m2 to 4 W/m2. This equates to approximately 31 kW of heating energy removed from each floor in the Livingstone Tower (10 W/m2 over approximately 3100m2 per floor), or 39 kWh/m2 p.a. (10W/m2*15 hrs/day*5 days/week*52 weeks/year).Similarly, increasing building utilisation from the current level of 24% to a target level of 40% nearly doubles the casual gains from occupants resulting in a reduced heating load.
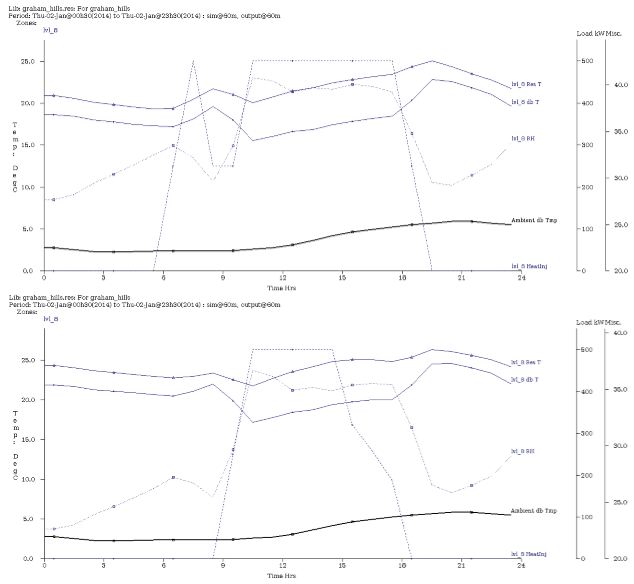
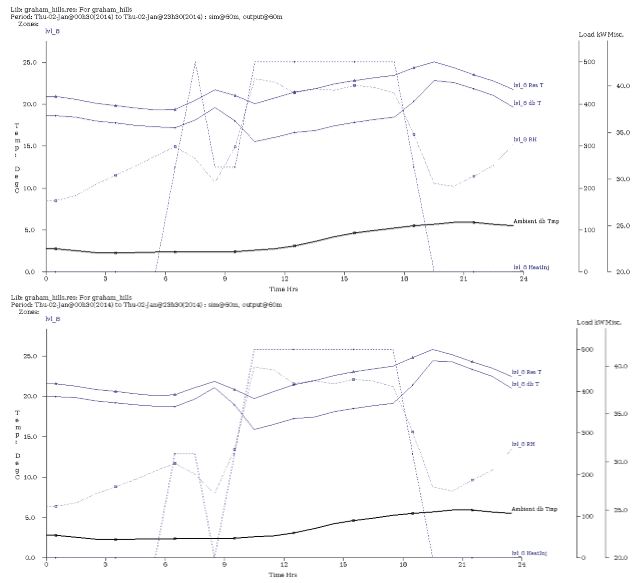
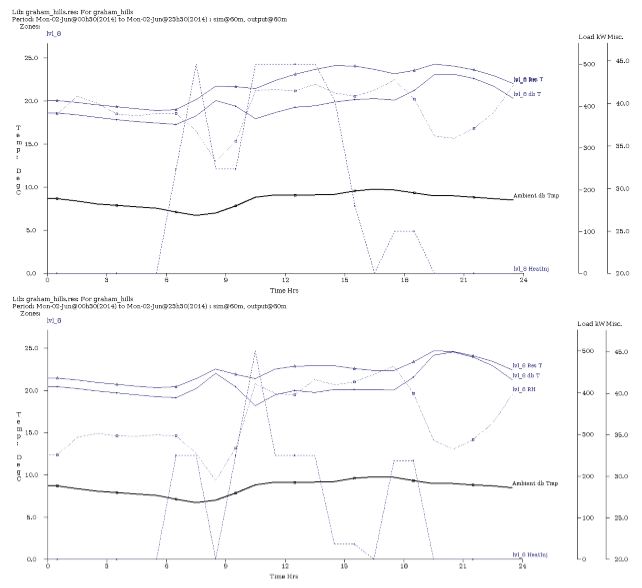
Improving air tightness
As the modelled building is reasonably leaky improving air tightness by just 0.5 air changes an hour (ACH) has a significant effect on heating energy required throughout the year.
Reduced heating energy by improving air tightness comes mostly in the mornings in the winter during startup (Figure c.1) and throughout the day in the summer (Figure c.2). This is due to the reduced volume of fresh air infiltrating the building that needs to be heated in order to reach the set points. Comparing Figures c.1 and c.2, the summer day has a greater reduction in overall heating energy required. This is consistent with expectations considering the difference between ambient and internal temperatures is greatly reduced in summer months compared to the typical winter case.
Cumulative upgrades
Figure d demonstrates the interactions between building upgrades. The magnitude of the heat load increase from the removal of casual heat gains in the zone (through lighting and PC upgrades) is greatly reduced when combined with energy saving measures.

Similarly, the proportional savings of each additional measure employed is reduced when compared to the effects of single measures on the base case.
Summary
The simulation results indicate that energy saving measures cannot be considered in isolation. It is crucial to understand the effects of cumulative measures in order to form a clear idea of what savings are likely.
The indicated savings from the simulation are very high at approximately 50%. The actual savings from these upgrades are likely to be lower due to inaccuracies in the simulation model and technical considerations. When applied to the demand data, in order to allow for these inaccuracies, heating savings were assumed to be 25% for the Graham Hills building.