Demand Reduction
Why reduce demand?
When considering methods to reduce carbon emissions in an inner city university campus most thinking tends towards installing a more carbon friendly source of energy to meet the current demand profile of the campus, however Tom Delay from the Carbon Trust has stated that “if we truly care about affordability, security and the environment we should first think about cost effective demand reduction and consider how we can use less energy – which means focusing on buildings, not just power plants and turbines.” (Delay, 2013). With this in mind it was necessary to determine ways in which the energy demand of an inner city university campus could be reduced.
Understanding inner city university campus demand
Before determining how energy demand could be reduced, it was necessary to determine what typically made up the existing demand profiles of inner city university campuses in the United Kingdom. The Carbon Trust released a paper discussing energy consumption within the Further and Higher Education sector, from which the below pie chart was featured in order to illustrate the general breakdown of the demand profile.
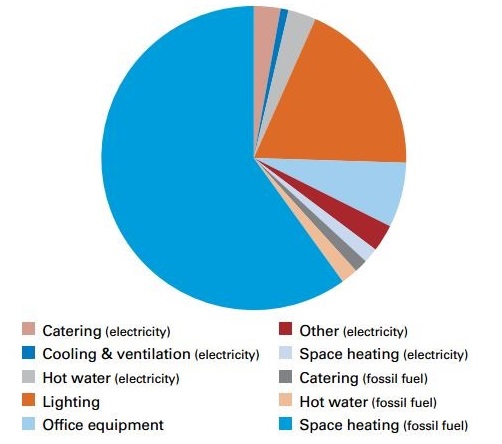
This pie chart shows that with regards to energy consumption, approximately 65% is dedicated to heating through burning fossil fuels. Due to the differing carbon conversion factors for electricity and fossil fuels, it was decided that the breakdown would need to be reassessed from a carbon emissions perspective as the point of the project was to reduce carbon emissions. For this an inner city campus, in this case University of Liverpool, was chosen and their carbon management plan from 2005 was analysed to determine if the necessary information was available. Within that document, a breakdown of their scope 1 and 2 carbon emissions was available and is shown below.
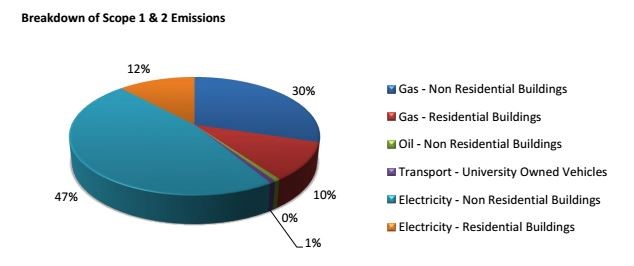
This pie chart gives a much different breakdown from the energy consumption data provided by Carbon Trust. When reviewing carbon emissions, electricity is the largest contributor with 59% whilst gas contributes 40%.
When taking both pie charts into account, it became clear that care would have to be taken to ensure that potential demand reduction pathways were not purely looked at from an energy perspective as the project was regarding carbon reduction first and foremost.
The following criteria were then used to decide which areas had the most potential for reducing energy demand for inner city campuses:
• Capital cost
• Financial savings
• Carbon savings
• Payback period
• £/tCO2 per annum
• Marginal Abatement Cost (MAC)
Based on the above criteria, the promising areas were:
• Desktops & monitors (PC's)
• Lighting
• Date centres
• Building upgrades
Strathclyde case study
As the group is based at the University of Strathclyde it was determined that it would be best to use the campus as a case study to determine what sort of demand reduction potential could be achieved to help the university meet their 50% carbon emissions reduction by 2030. In order to do, existing meter data and EPC data amongst other sources were analysed to determine the approximate carbon contribution and energy consumption of systems within the campus.
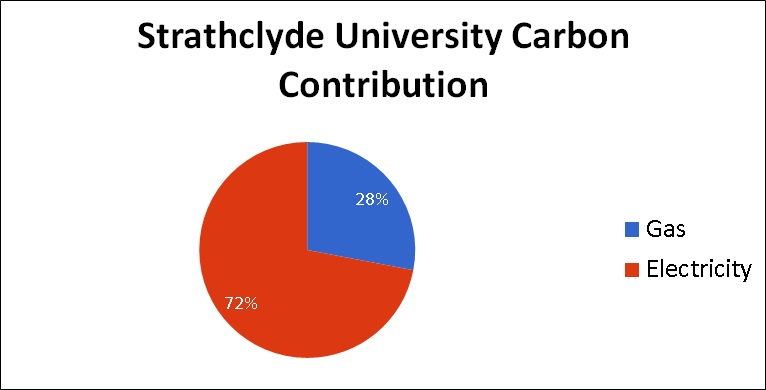
Using meter reading data and DEFRA carbon factors, it was determined that electricity contributed 72% of carbon emissions for the university which was considerably higher that the example of the University of Liverpool mentioned earlier.
With regards to the gas consumption on the campus, it is almost exclusively used for heating, so it was determined that there was no need to go into more detail on the sources of use. For electricity however, it is much more varied and various methods were used to determine the breakdown. The result of these are shown below.
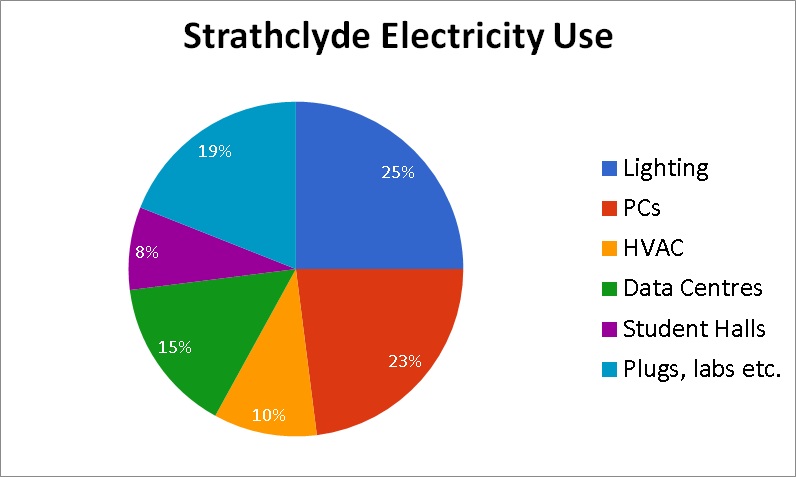
It can be seen that a quarter of the electricity consumption is due to lighting on site, with PC's contributing to just under a quarter. Data centres on campus are also a significant contributor to electricity consumption and for the purposes of this project have been considered a separate entity to PC's. The HVAC system on campus contributes approximately 10% of the electricity consumed on campus.
The remaining elements on the graph are "Student Residences" and "Other" which were not looked at in detail, but it was acknowledged that combined they contribute 27% of electricity consumption on campus. The electricity consumed in the student residences were largely unaccountable and will continue to be unless significant metering is installed throughout the residences on campus. It is however generally accepted that the electricity consumption is due to household appliances. The "Other" section consists of multiple systems such as lab equipment which again require a greater level of metering in order to properly monitor their electricity usage.
References
Carbon Trust. (2013) Further and Higher Education: Training colleges and universities to be energy efficient. Available at: http://www.carbontrust.com/media/39208/ctv020_further_and_higher_education.pdf (Accessed: 16 April 2016).
Delay, T. (2013) Energy efficiency in non-domestic buildings. Available at: https://www.carbontrust.com/news/2013/09/energy-efficiency-in-non-domestic-buildings/ (Accessed: 16 April 2016).
University of Liverpool. (2011) Carbon Management Plan. Available at: https://www.liverpool.ac.uk/media/livacuk/sustainabilitynew/documents/FM00135_Carbon_Management_Plan.pdf (Accessed: 16 April 2016)