Building Upgrades
The key area identified in order to achieve carbon savings in buildings (aside from Lighting, PCs and data centres) are Heating, Ventilation and Air-Conditioning (HVAC). This can be achieved by improving the thermal performance of buildings (through fabric improvements) and by upgrading HVAC plants and controls.
On the University of Strathclyde campus, HVAC accounts for 10% of electricity carbon emissions (so 7.8% of total campus emissions) while gas consumption for heating makes up 28% of total campus emissions (see demand reduction).
Fabric upgrades
In order to improve thermal performance in buildings it is necessary to improve their fabric. This can be achieved by replacing single glazing with double glazing and by insulating walls and roofs.
In terms of the type of insulation that is suitable, cavity fill (or cavity wall insulation) is not possible in areas with driving rain as it can cause issues with damp (BRE, 2011). Much of the West of Great Britain falls into this category (Kingspan, 2014).
In the interests of developing a generalised strategy for inner city campuses it was assumed that external insulation with 100mm of polyurethane boards would be used. It is a robust material with good insulating properties that is commonly used for external wall insulation (BING, 2006). Internal insulation wasn’t considered as it would be more disruptive to the spaces being insulated to install.
HVAC
HVAC encompasses a wide range of systems from boilers to pumps and fans for air handling units. Therefore the saving potentials are also varied.
In terms of the heating supply side, the most effective way to increase boiler efficiency is by centralising all campus boilers and replacing them with heat exchangers as part of a district energy network (DEN). This reduces gas consumption.
For reducing electricity consumption the upgrades available range from installing destratification fans in lecture theatres (savings of up to 20% (Carbon Trust, 2012a)) to using variable speed drives in the fan and pump motors (savings of up to 50% (Carbon Trust, 2011)) and implementing control measures (savings of up to 15% (Carbon Trust, 2012b & 2007). These savings are highly dependent on the state of existing buildings, their systems, uses and shapes so must be considered in relation to whichever context they are applied to.
Strathclyde case study
The energy savings from fabric upgrades were approximated by comparing the heat lost per year before and after upgrades. A simple heat flow calculation was used as follows:
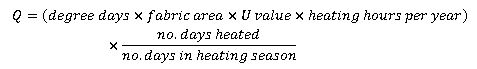
Where:
• Degree days represent the number of days in a typical year that ambient temperature is below the heating setpoint of a building. Data from Vesma (2016) based on a standard base temperature of 15.5OC.
• Fabric area was calculated by measuring the perimeter of the buildings from drawings provided by the University Estates Department or, where data was unavailable, by measuring satellite images. The perimeters were then multiplied by floor height and number of floors to give total external area. The ratio of glazing to wall area was measured where possible and otherwise approximated from observation.
• U value (W/m2K) represents how quickly heat is lost through the fabric per unit area and temperature difference. It is calculated by weighting the wall and glazing U values in order to obtain an overall building external area U value. This is the only variable that changes in the simplified heat loss calculation.
• Heating hours per year were approximated by comparing degree days with an August-May heating season assuming 10 hours heating 5 days a week.
• No. days heated refers to the total number of days a year the building is heated. It is calculated by comparing the degree days with the heating season period.
• No. days in heating season are the number of degree days in the August-May heating season.
The benefit of using a simplified calculation method based on U values and building external area is that it is entirely independent of factors such as building use and occupancy patterns. The downside is that it is a very rough approximation.
For HVAC upgrades, there was no projected savings in gas from the supply side as a DEN was assumed to be implemented. The total installed capacity for boilers on campus is 30-40MW while aggregate heat demand for the campus never peaks above 19MW. So, even after allowing for a pessimistic 50% heat loss in a DEN, centralising boilers still provides a net reduction in capacity while reducing operation and maintenance costs.
Allowing for variation between building types, uses and sizes, electricity savings for HVAC systems is approximately 10% over the campus (or 0.7% of baseline emissions).
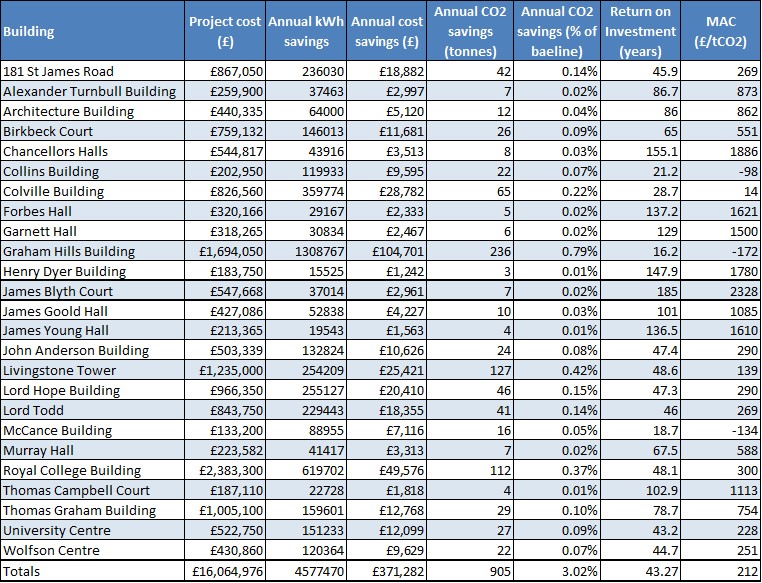
The results from these calculations were compared with simulation results obtained from SBEM and ESP-r. They were consistently much lower than simulated energy savings and savings from similar examples in literature. As such, they represent a conservative or worst case estimate of energy and cost savings. Table a summarises the results from these estimates.
Summary
From Table a it is clear that building upgrades perform very poorly compared to lighting and PC upgrades. There is less saving potential and higher costs involved.
Not all buildings are equal in their potential for upgrades. Some are new builds (such as the state of the art Technology and Innovation Centre), some have already been refurbished. Others are listed buildings so perform very poorly in terms of energy and cost savings, never paying back their investment. There is a therefore high variation in energy and financial performance between the buildings on campus.
An important point about fabric upgrades is that the ratio of surface area to internal volume has a very significant effect on project cost and energy savings. Buildings such as the Architecture Building have buttress like extrusions in the facade that don’t add much usable volume to the structure but greatly increase the perimeter (and therefore external area) of the building. As heat loss is proportional to exposed surface area, this results in increased heat losses (and energy use) with no meaningful increase in internal floor area. This results in a very expensive building upgrade cost for very little energy or cost savings (Table a). MAC and payback periods for buildings like this are very poor.
Although building upgrades in isolation are financially unattractive they can be made more viable by bundling them with better performing projects such as lighting or IT upgrades.
References
BRE (2011) Wind driven rain: assessment of the need for new guidance [pdf] Available at: http://www.gov.scot/resource/0040/00402330.pdf (Accessed: 30 April 2016)
Kingspan (2014) Exposure Zones, Cavity Wall Insulation and Residual Cavities [webpage] Available at: http://blog.kingspaninsulation.co.uk/exposure-zones-cavity-wall-insulation-residual-cavities/ (Accessed: 30 April 2016)
BING (2006) Thermal insulation materials made of rigid polyurethane foam (PUR/PIR) [pdf] Available at: http://www.excellence-in-insulation.eu/site/fileadmin/user_upload/PDF/Thermal_insulation_materials_made_of_rigid_polyurethane_foam.pdf (Accessed: 30 April 2016)
Vesma (2016) Degree-day data [webpage] Available at: http://www.vesma.com/ddd/regular.htm (Accessed: 30 April 2016)
Carbon Trust. (2012a). How to implement de-stratification fans [pdf]. Available at: https://www.carbontrust.com/media/131488/ctl023_how_to_implement_de-stratification_fans.pdf (Accessed: 19 April 2016)
Carbon Trust. (2011c). Variable Speed Drives [pdf]. Available at: https://www.carbontrust.com/media/13063/ctg070_variable_speed_drives.pdf (Accessed: 12 April 2016)
Carbon Trust. (2007). Building controls: Realising savings through the use of controls [pdf]. Available at: https://www.carbontrust.com/media/7375/ctv032_building_controls.pdf (Accessed: 20 April 2016)
Carbon Trust. (2012b). How to implement optimum start control [pdf]. Available at: https://www.carbontrust.com/media/131445/ctl035_how_to_implement_optimum_start_control.pdf (Accessed: 19 April 2016)