Energy Performance
In order to achieve the Net Zero Energy Building targets we first need to know the total existing demand of the building and then compare it to the renewable supply from on-site generation.
In order to find the demand of the Visitor Centre the ESP-r modelling tool has been used, simulating all electricity equipment included in the building. A total annual demand of 6.5 MWh was calculated considering electric heaters as the heating supply option. This corresponds to a specific energy demand of 59 kWh/m2. With regards to the renewable technologies installed for on-site electricity generation, there are currently 18 PVs with a capacity of 4.5 kW giving an annual supply of 5.34 MWh.
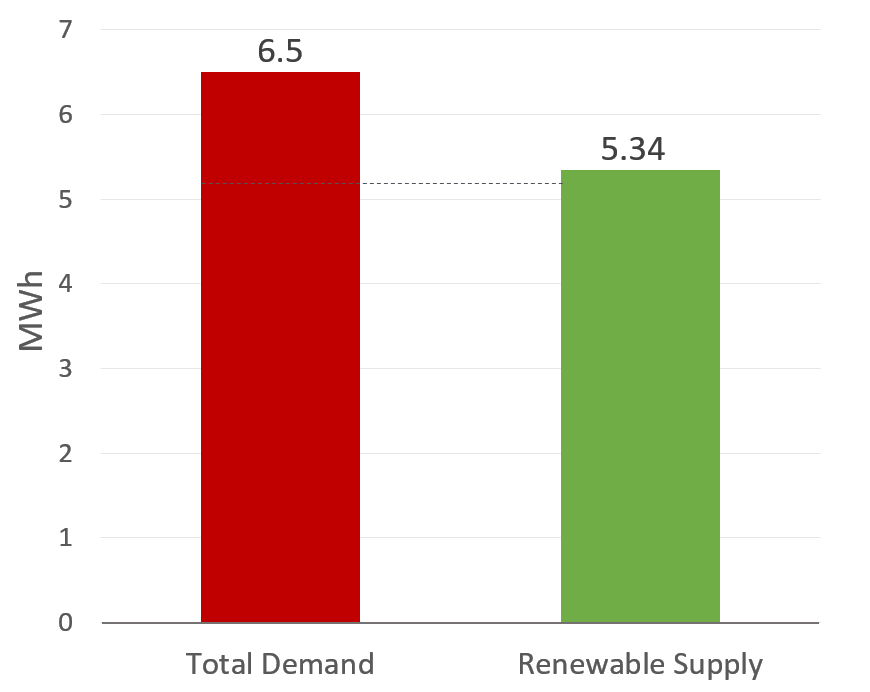
Graph 1: Annual Energy Performance
As clearly indicated in Graph 1, the supply does not match the demand of the Visitor Centre on an annual basis and therefore the missing supply is provided from the grid. As can be seen in Graph 2 below, on a day to day basis, demand and supply rarely match.
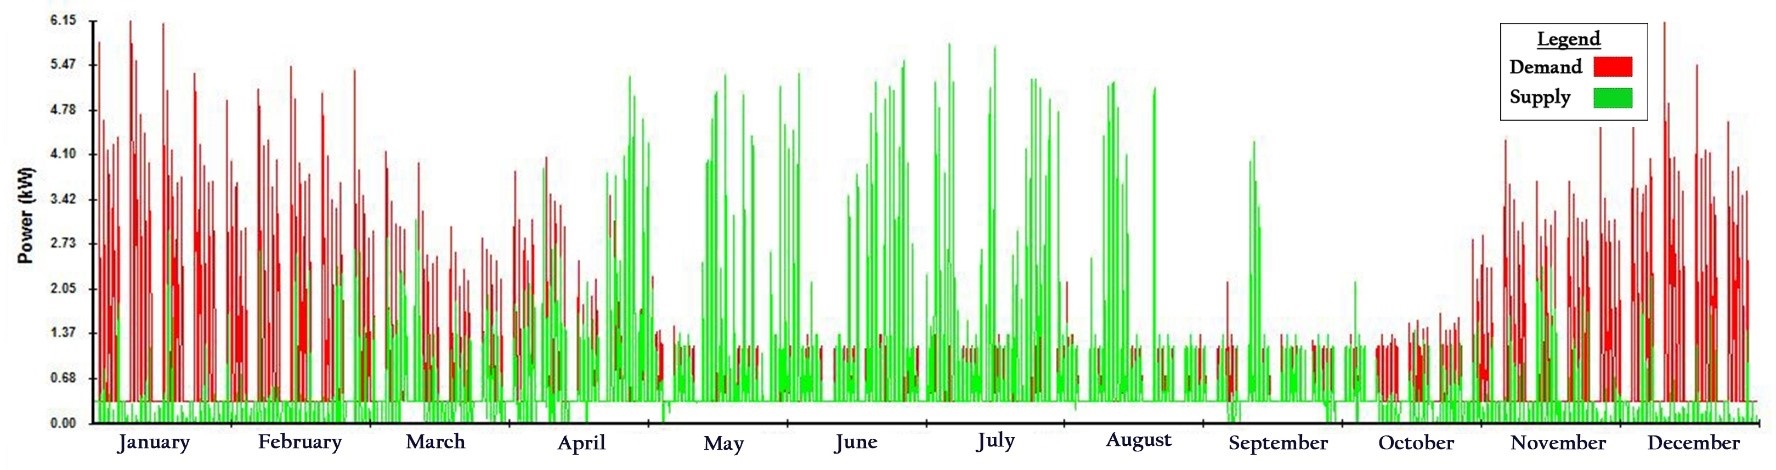
Graph 2: Annual Demand and Supply Profile
The greatest mismatch occurs during winter, when energy load reaches its highest (due to increased heating demands) and supply from PVs is considerably low. On the contrary, summer demands are much lower (there are not any heating requirements), whereas on-site generation from PVs is remarkably increased. This leads to a very high energy surplus, which is eventually wasted as there is not currently the potential of exporting energy to the grid. However, energy imports from the main grid during summer are minimized.
Regardless of any temporary energy mismatch, in order to achieve the project aim, the total local renewable supply must at least meet or outweigh the building demands, for either of our Net Zero Energy targets.