Demand
Modelling
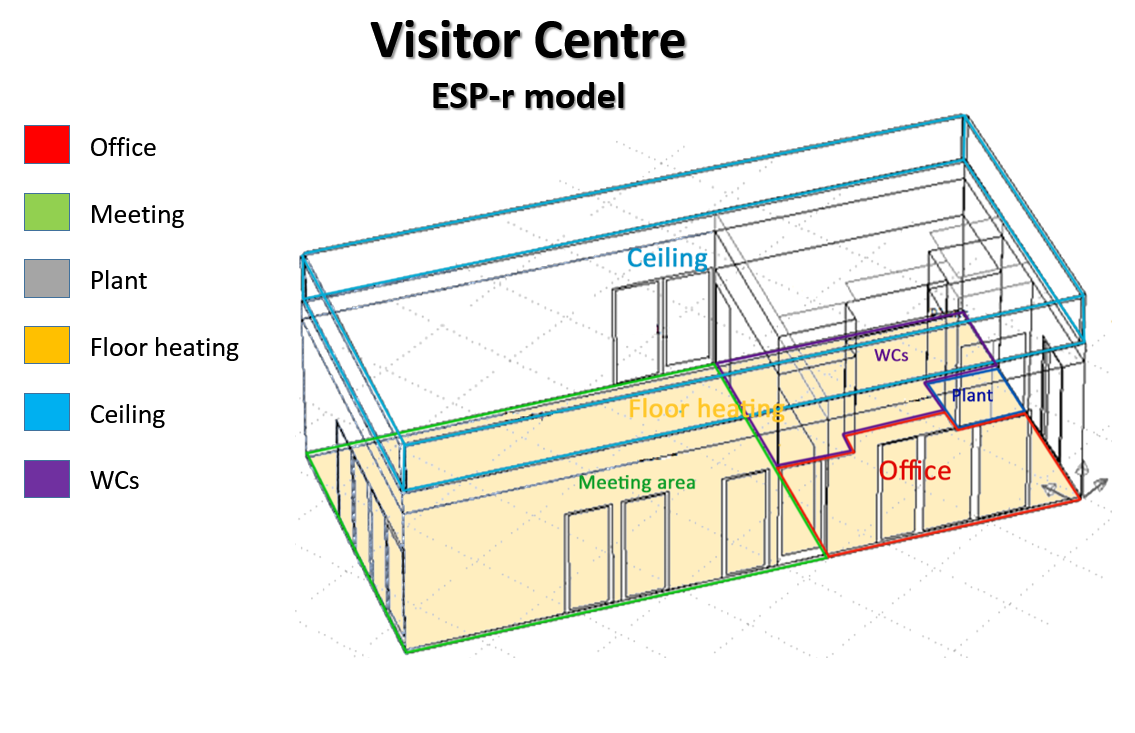
The Visitor Centre has been modelled using ESP-r software. Figure 1 depicts an overview of the building model.
Day types
In order to represent the real use and occupancy patterns of Visitor Centre and evaluate their influence on the building’s energy and environmental performance, separate day types were created. They involved different occupancy, equipment, lighting, heating and ventilation schedules and controls which also varied according to the use of each zone. More specifically, the 6 different day types were created and were defined as follows:
-
Weekdays:
- Included Monday and Friday as working days.
- 1-3 occupants in the office area from 9am. to 6pm.
- No occupancy was modelled for the other zones.
-
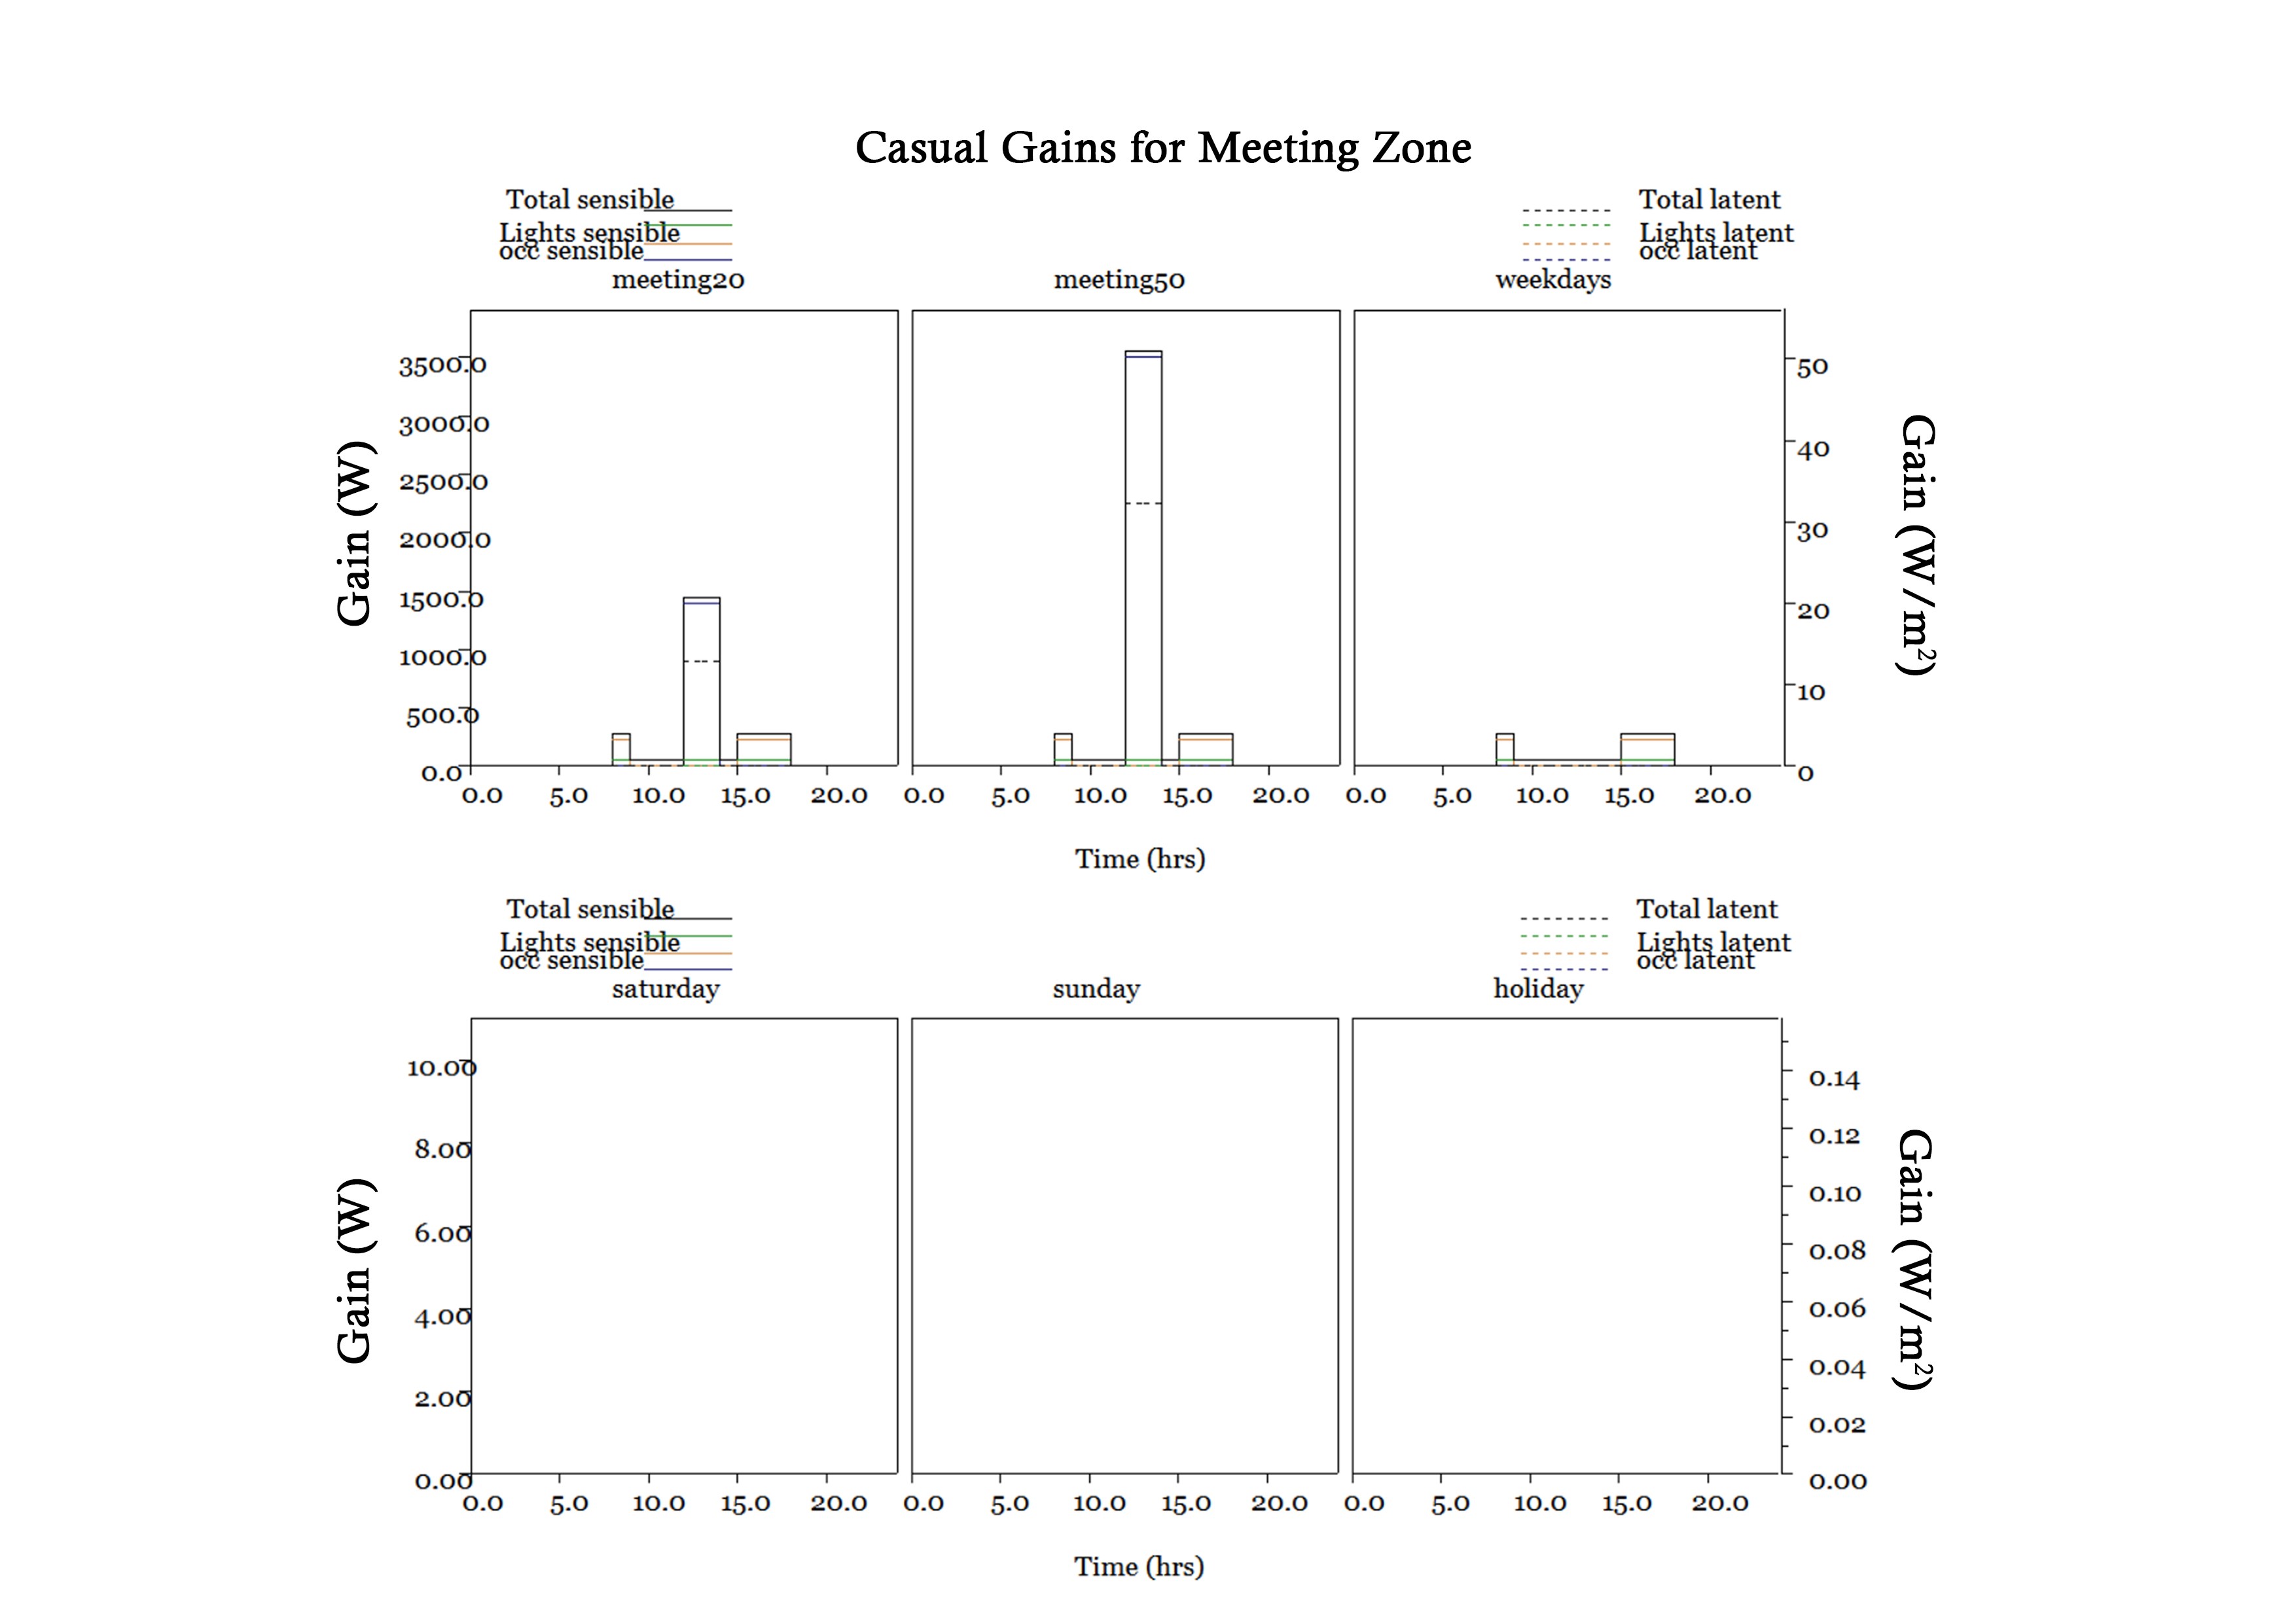
Meeting20:
- Accounts for small meetings held twice per week in the meeting zone.
- Assumed to be held every working Tuesday and Thursday, from 12pm. to 14pm.
- Increased occupancy of 20 people in the meeting zone and steady in the office.
- Use of small power devices and ventilation schemes were increased accordingly.
-
Meeging50:
- Accounts for large meetings held once per month in the meeting zone.
- Assumed to be held every first Wednesday of the month, from 12pm. to 14pm.
- Increased occupancy of 50 people in the meeting zone and steady in the office.
- Use of small power devices and ventilation schemes were increased accordingly.
-
Saturday:
- No occupancy.
- Low power consumption (only stand-by equipment) and reduced control setpoints.
-
Sunday:
- No occupancy.
- Low power consumption (only stand-by equipment) and reduced control setpoints.
-
Holiday:
- Accounts for bank holidays during the year.
- No occupancy.
- Low power consumption (only stand-by equipment) and reduced control setpoints.
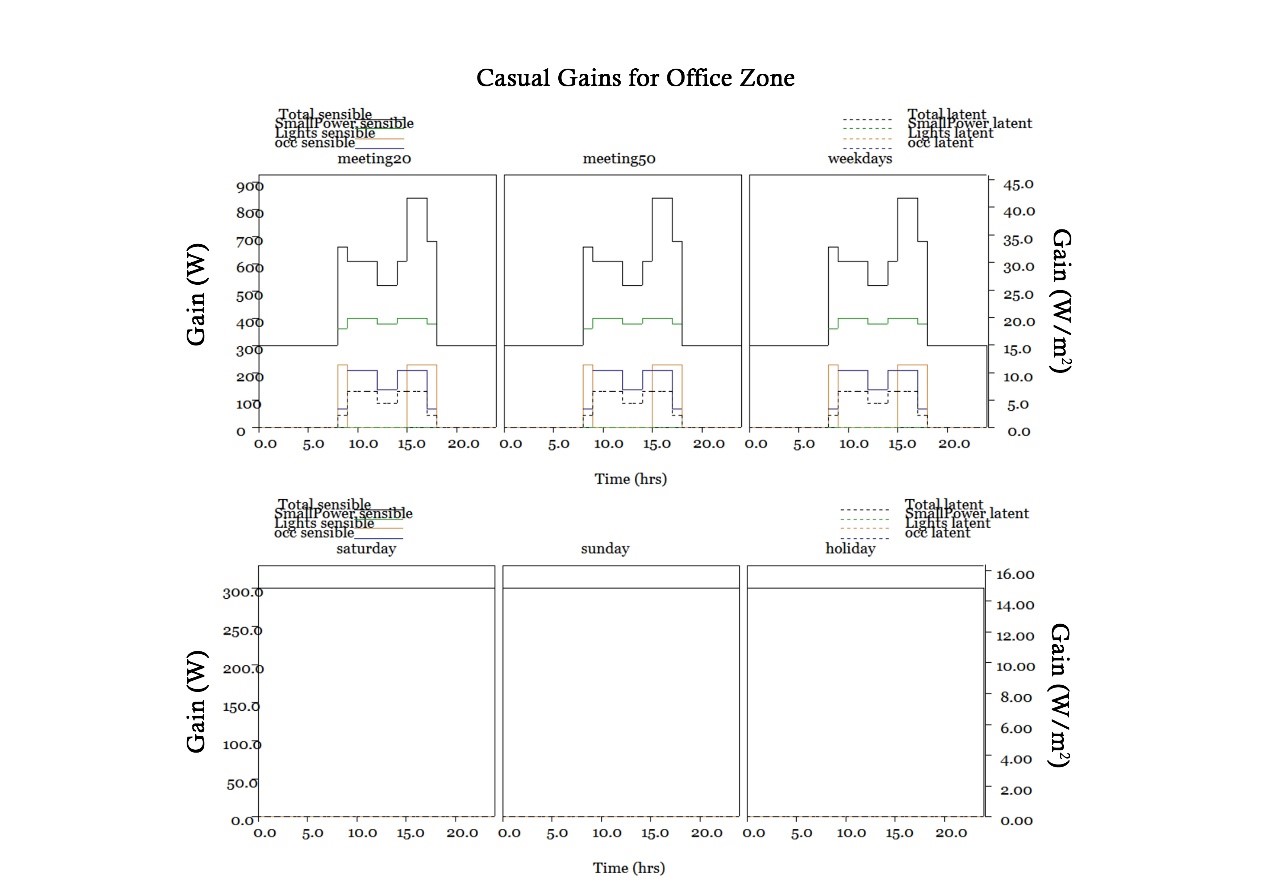
Casual Gains
The casual gains (occupants, lighting and small power equipment) for the offices and the open space meeting zone vary by day type and hour.
Occupancy:
The sensible and latent loads assumed per occupant are 70W and 45W, respectively.
Equipment:
For the small power devices, sensible load ranged between 300-400W during office hours and were steady at 300W for weekends and holidays.
Lighting:
Giving the large daylight harvesting, the lights were modelled to be on between 8-9am. and 15-18pm. In the office and meeting zone this lighting load is 232W and only for working days.
Heating Controls
The heating control loops were incorporated into the model for three of the building zones; Office, Meeting and WCs as presented below:
| Heating Setpoints | |||
|---|---|---|---|
| Period | Office | Meeting | WCs |
| 0:00 – 7:00 | 5℃ | 5℃ | 5℃ |
|
7:00 – 18:00 (working days/ weekends) |
22℃ / 5℃ | 20℃ / 5℃ | 20℃ / 5℃ |
| 18:00 – 24:00 | 5℃ | 5℃ | 5℃ |
Ventilation
The ventilation rates that were used in the model for the main three building zones were in line with the relevant CIBSE standards, in order to ensure indoor air quality (IAQ).
| Occupancy Category | Ventilation Requirements |
|---|---|
| Conference/Meeting | 2.5 L/s per person |
| Office | 2.5 L/s per person |
| WC | 12.5/25* L/s per unit |
*the 1st value was implemented during working hours while the 2nd during meetings
Firstly, the above values were converted into Air Change Rates (ACR) or air changes per hour (ac/h), according to the number of occupants of each zone.
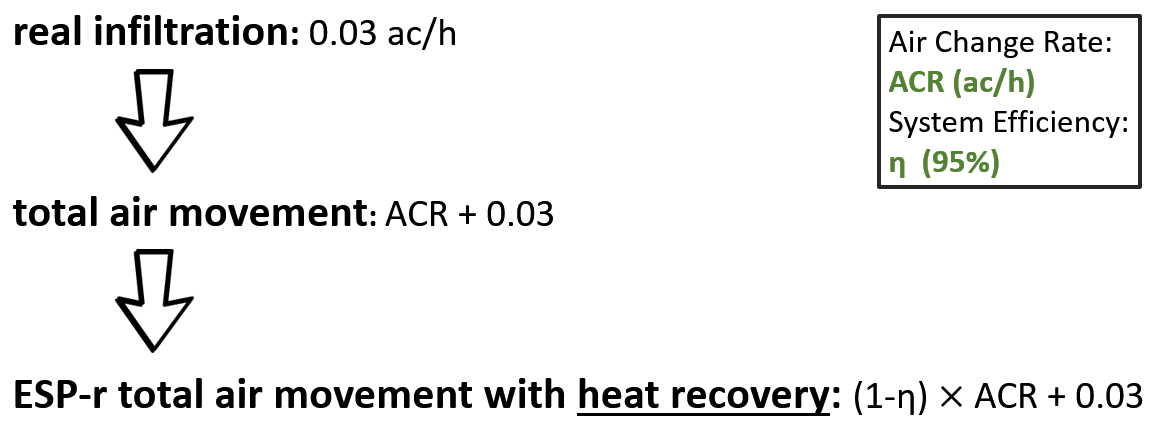
Modelling the air movement at Visitor Centre should also take into account that there was already a Mechanical Ventilation with Heat Recovery (MVHR) unit installed, with an efficiency of 95%. In order to evaluate the reduced energy demands due to the heat recovered by the MVHR system, these ac/h values were multiplied with the factor 1-η, where η is the efficiency of the MVHR unit.
With regards to the modelling of the airtightness at Visitor Centre, we used the value of 0.6 ac/h which meets the Passive House criteria. This was adjusted to the real one, namely at 0.6/20=0.03 ac/h.
The total air movement between Visitor Centre and the outside was accounted as the sum of mechanical and natural air changes. Therefore, the above ac/h values were added and input into the ESP-r model.
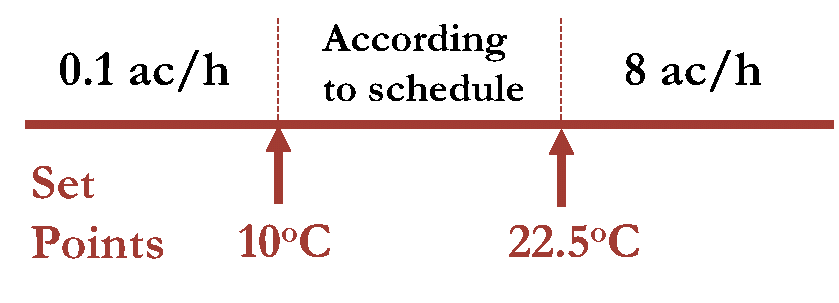
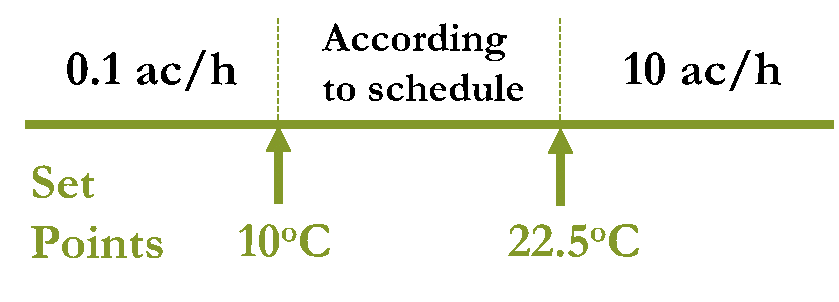
It is also important to mention that controls were set in order to adjust ventilation rates according to indoor temperatures. This was implemented in order to ensure Indoor Environmental Quality by bringing more fresh cool air from outside into the building, when temperature increased above the critical point of 22.5°C. In particular, controls for higher ventilation rates in combination with effective shading were effectively used to tackle the summer overheating.
Some basic ventilation controls implemented for the office, meeting and WCs zone are shown below:
Ventilation controls for office zone
Ventilation controls for meeting zone
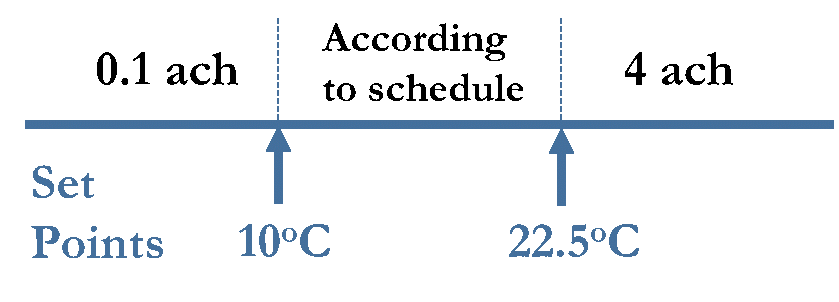
Ventilation controls for WCs
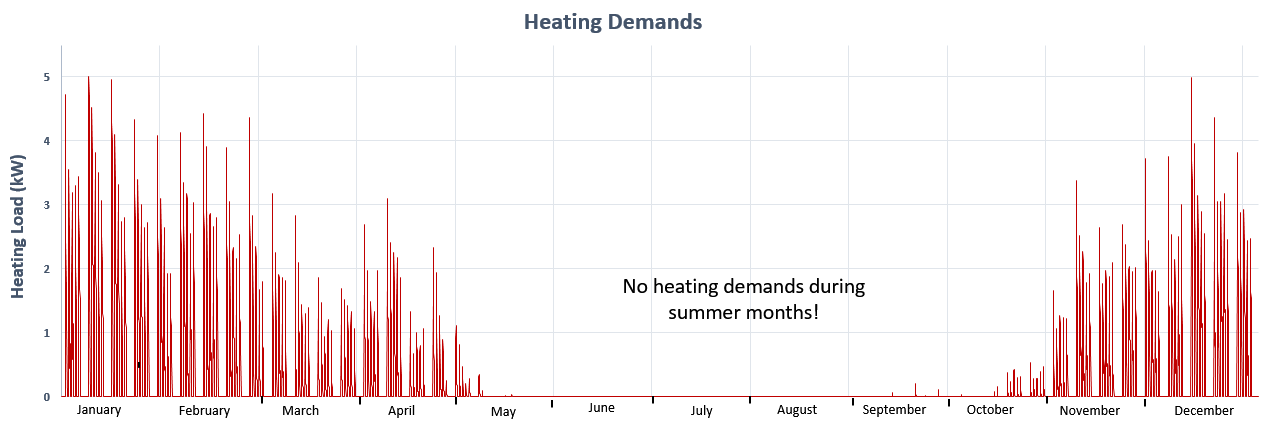
Heating Demands
Finally, the ESP-r model was used to obtain the necessary outputs regarding the thermal performance of our building, including heating loads and internal temperatures, which were used in the next stages of our project. The annual heating demand breakdown for our building consists of the three zones where we have heating control loops, as below:
| Zone |
Heating requirements (kWh) |
|---|---|
| Office | 268 |
| Meeting | 1226 |
| WC | 603 |
| TOTAL | 2115 |
The above values represent the heating load assuming that the heating system is electric heaters.
The graph of annual total heating demands for the Visitor Centre is as below: