Energy Analysis - Net Zero Site Energy Building
Our findings in order for the Visitor Centre to meet the target of Net Zero Site Energy Building are presented as below. These results were exported from MERIT software, where the demand-supply matching process was executed.
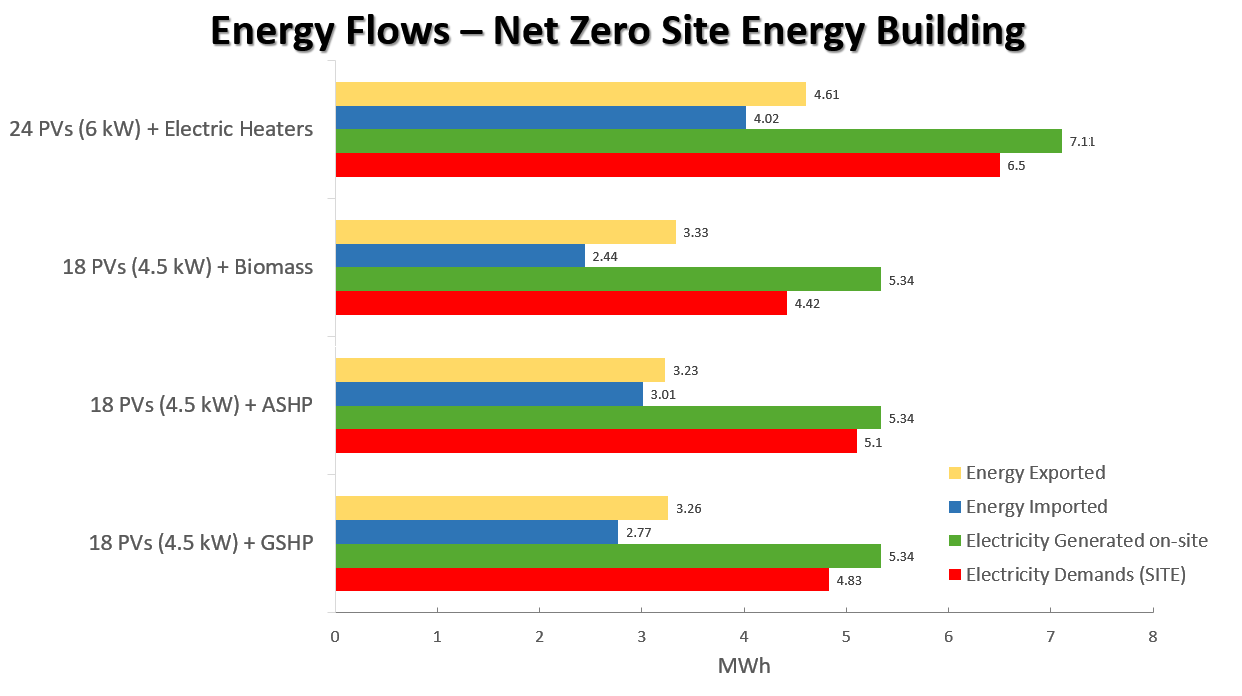
The bar chart below displays the energy flows (in MWh) for each combination. Note that for each heating option, only one (the best) combination was selected.
Annual Graphs
The annual graphs of demand-supply matching for each of the above combinations, exported from MERIT software, are shown below:
24 PVs (6 kW) + Electric Heaters:
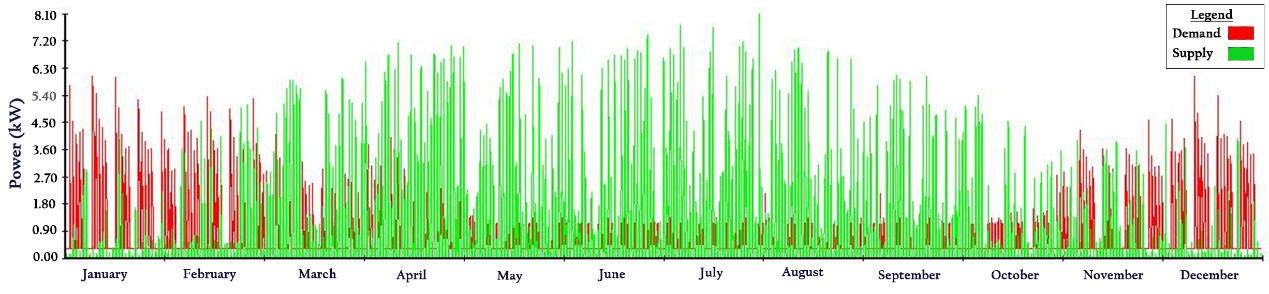
In this case electrical demands are the highest, due to the energy-intensive electric heaters as the supply option. As a result of the greater number of PVs installed, energy exported is also increased.
18 PVs (4.5 kW) + Biomass Boiler:
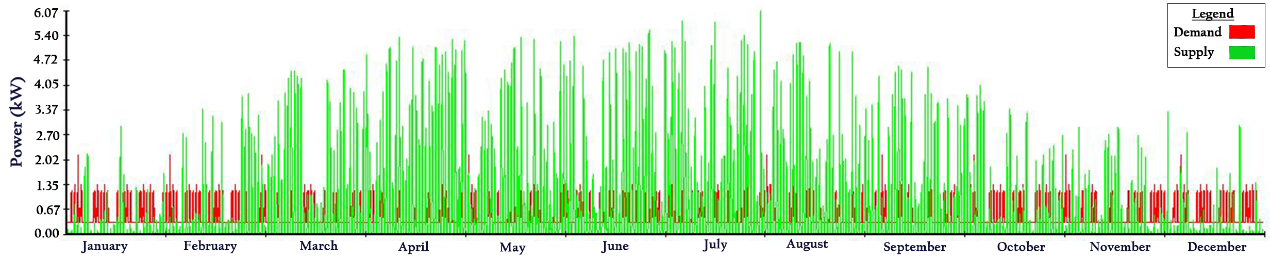
This is the supply mix with the lowest annual electrical demand profile, since heating demands are fully covered by wood pellets. This is why demand was considered to be constant throughout the year. However, this combination achieves the lowest match rate between supply and demand.
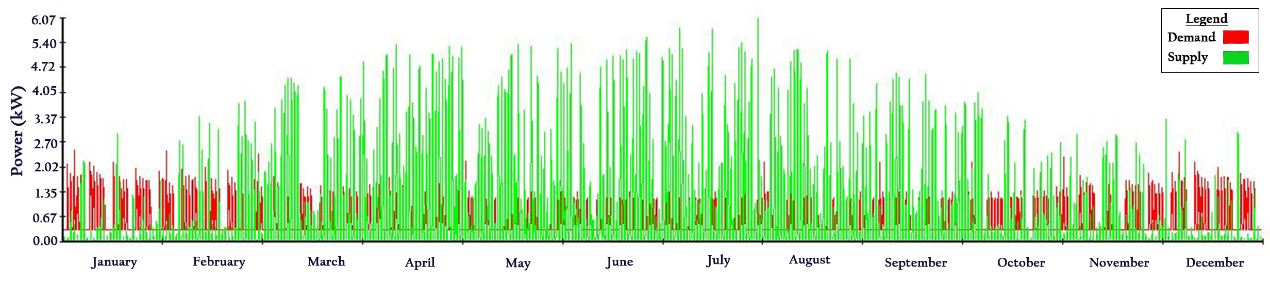
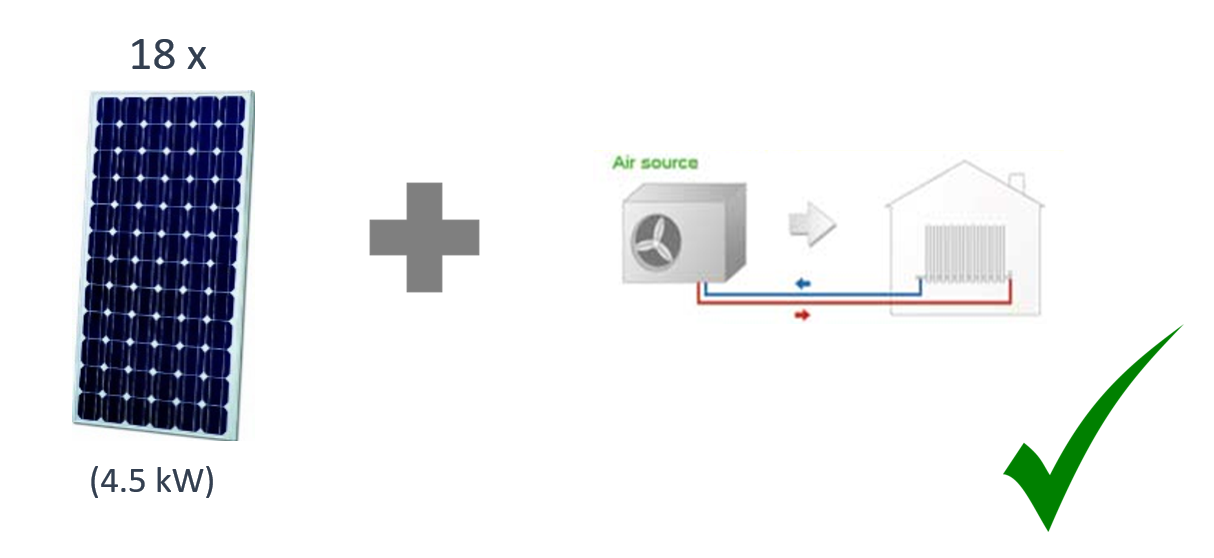
18 PVs (4.5 kW) + ASHP:
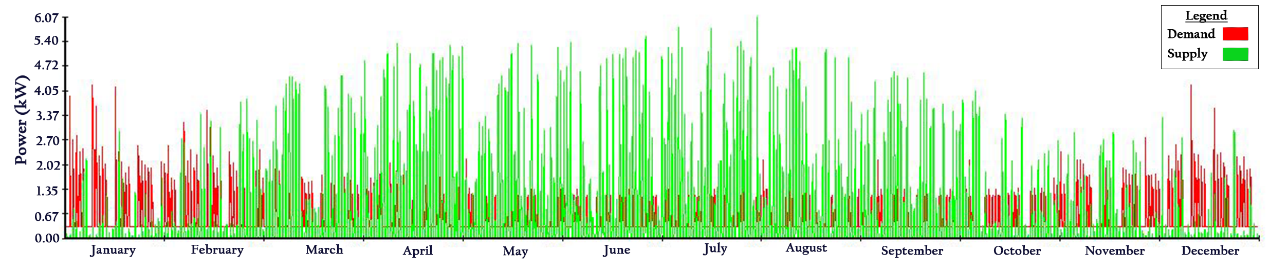
This is the case with the highest demand/supply matching rate, at 95.5%. Demands are considerably reduced throughout the year due to the ASHP, yet they are the second highest among the four combinations presented.
18 PVs (4.5 kW) + GSHP:
Using a GSHP leads to overall reduced electrical demands over a year and also lower requirements for energy imports.
Our suggestion
After comparing the energy performance for each of the above selected supply mixes, the overall best combination to achieve a Net Zero Site Energy Building was selected. The criterion was the electricity generated on-site to cover the site electricity demand and at the same time be as close as possible to it.
According to this, our suggestion for a Net Zero Site Energy Visitor Centre includes a 5 kW ASHP as a heating supply option together with the existing PV array of 4.5 kW as the electricity supply option.
This gives a total annual electricity generated on-site of 5.34 MWh while the total site electricity demand is 5.1 MWh throughout the year.
3.23 MWh are exported annually to the grid while the annual electricity imports are reckoned at 3.01 MWh.