


ESP-r Intermediate Model
We decided to investigate what effects an increase in ICT would have on a building with L Standards. The same simulations were carried out as with the advance standard model, with the number of computers in each classroom being varied. This included a little ICT uptake (1 computer), a moderate uptake (15 computers) and an aggressive uptake (32 computers). The only difference between the advanced model and the intermediate was the U-Values associated with the external walls, the floor and the glazing. The values used can be found in table 1 below.
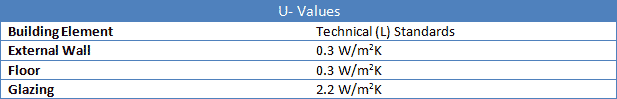
Table 1: Associated U-Values with Model
Temperature Effects
Graphs 1 and 2 below show the results achieved from our analysis for the hours the classroom is above 26ºC and 28ºC, respectively. Again it can be seen that as the number of computers increase, the hours above 26ºC also increases. It can also be observed that as we move towards future computers and tablet devices, the number of hours above 26ºC is far lower. This is because of the lesser associated heat being dissipated to the environment. It can also be observed from Graph 2 that the temperature of the classroom does not exceed the legal requirement of 80 hours above 28ºC.
When comparing the results from both models, the temperatures in a classroom with L Standards are significantly lower than that of the building with advanced standards, as expected. This is because buildings with advanced standards are designed to keep the heat in and the cold out.
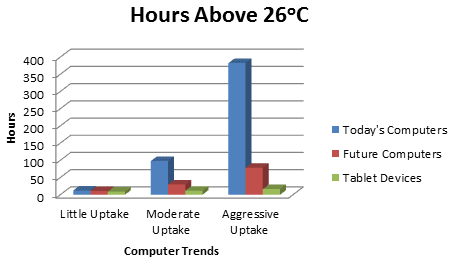
Graph 1: Hours above 26ºC
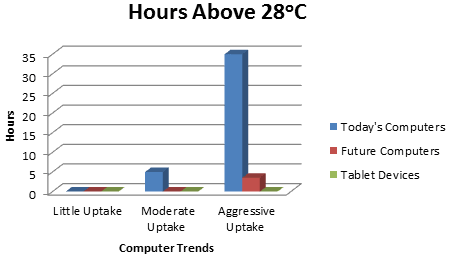
Graph 2: Hours above 28ºC
Energy Consumption
For our model's purposes, the energy consumption is defined by the energy supplied to the heating only. Boiler efficiencies can vary, thus increasing the total energy consumption for the heating system by a percentage. This aspect is analysed in the carbon dioxide emissions page of this website.
From the graph below we see that both tablets (with any uptake level) and little uptake of any computer type have a minor effect on energy consumption. Today's computers at an aggressive uptake has the most significant impact on consumption, increasing 17.5%.
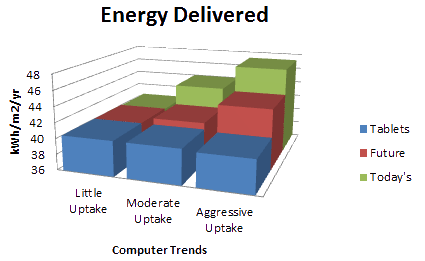
Graph 3: Energy Consumption For Intermediate Model
Further comparisons can be made between our Advanced and Intermediate Standard models. The graph below shows the energy consumption of different uptake levels of the three ICT types in the two standards. Similarly to the trends previously described, the lesser standard, along with more inefficient devices and aggressive uptakes lead to higher consumption. The highlighted bars are worth noting. They demonstrate that an intermediate standard building with aggressive uptake of future computers performs similarly to advanced buildings with aggressive uptake of today's computers. This means that large investments in higher building standards, hoping to achieve lowered energy consumption, could be negated by the ICT in use. Analogously, an intermediate standard building can improve its consumption, achieving similar results to the advanced building, by employing the most efficient ICT, rather than investing in new construction.
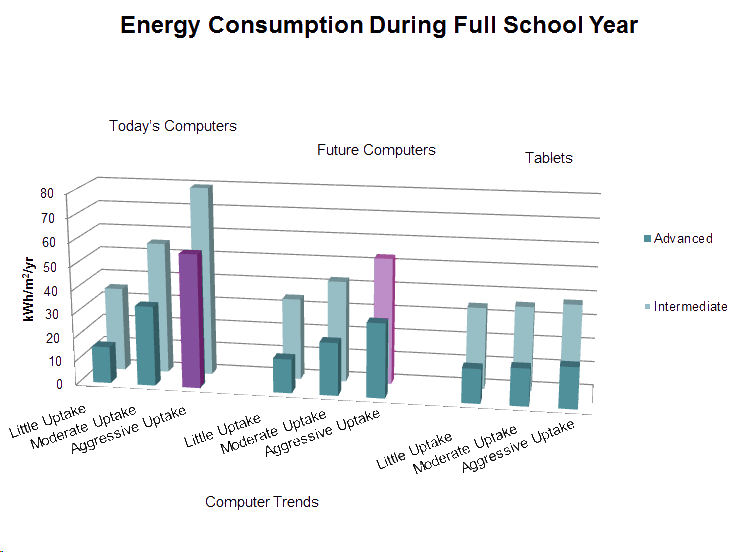
Graph 4: Advanced vs. Intermediate Energy Consumption