


Emissions & Cost Analyses
Carbon dioxide and cost analyses have been applied to the energy results obtained from the simulation. The CO2 intensity value has been taken from DEFRA. We have used the 2007 value of 0.54284 KgCO2/kWh of electricity delivered. To obtain total kWh/m2/yr consumed, the heating energy values taken from our results were divided by the efficiency of the heating system, giving us the kWh used by the heating system, then were divided by the floor area of the classroom (60.1 m2). The kWh/m2/yr of the ICT equipment was then found. For example, Today’s Computers at 60 W were multiplied by 6 (the number of hours running per day) x 5 (the number of days running per week) x 42 (the number of weeks running per school year). This gave 75,600 Wh/year. This value was then divided by the classroom floor area and by 1000, giving 1.25 kWh/m2/yr for one of Today’s Computers.
To calculate the cost of the energy used, the total kWh/m2/yr was multiplied by the price per kWh. Additionally, the total kWh/m2/yr was also multiplied by the CO2 intensity of a kWh to calculate the emissions. The results for both CO2 and cost analysis are shown in the table below.
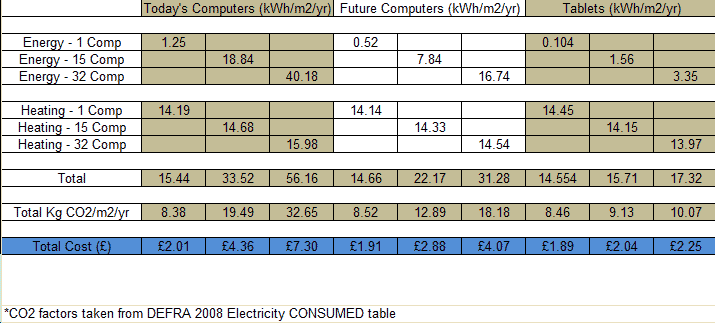
Table 1: Emissions & Costs
(Energy Delivered to Classrooms Only)
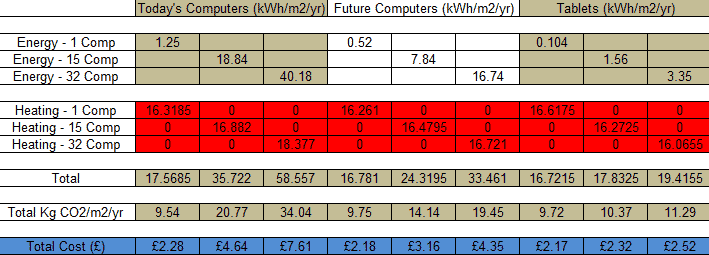
Table 2: Emissions & Costs With Boiler Efficiency
(Total Energy Consumed)
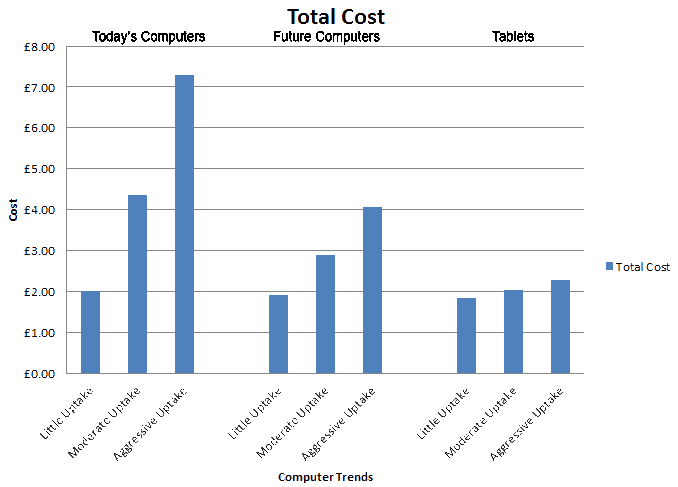
Graph 1: Cost Based on Computer Type
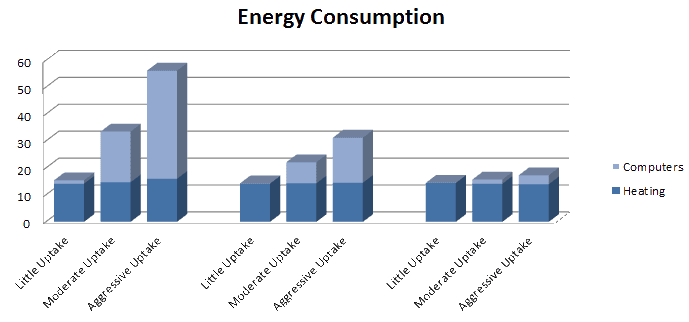
Graph 2: Energy and Heating Based on Computer Trends