


ESP-r Advanced Model
Temperature Effects
As stated earlier, three different computer types for our modelling have been used: today’s computers (60 W), future computers (25 W) and tablets (5 W). Computers produce heat while running. This heat is dissipated to the external environment, in our case a classroom. The more computers present in the classroom, the larger the heat gains are from the computers. Through our modelling we have been able to obtain results for the number of hours that air temperature exceeds 26°C and 28°C. The greater the number of running computers present in the classroom corresponds to more hours over 26°C or 28°C. The number of computers used in each classroom was varied. Ranging from little ICT uptake to moderate ICT uptake to aggressive ICT uptake. For little ICT uptake we used 1 computer; moderate ICT uptake used 15 computers and aggressive ICT uptake used 32 computers. This represents each pupil having his/her own individual computer, based on trends indicated in our questionnaire and literature review. It was decided to run a simulation with an overhead projector with today’s computers to see what affects it had on internal temperature. We decided not to run the future simulations (25 W and 5 W) with a projection device as it is undefined what will be used in the future for display purposes.
Table 1.1 shows the simulations which were run. By varying the number of computers used and the computer type, results were obtained showing the numbers of hours the internal temperature exceeds above 26°C and 28°C.
Table 1.2 below displays the results from this simulation.
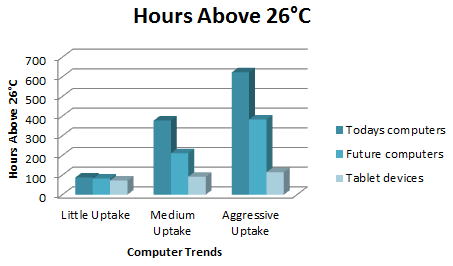
Graph 1: Hours Above 26ºC
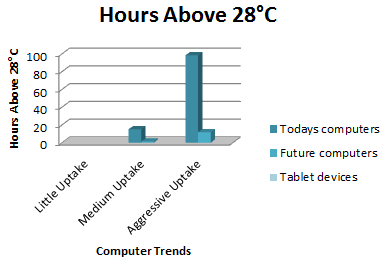
Graph 2: Hours Above 28ºC
From the results it can be seen that as computer power decreases, its associated heat emitted to the environment reduces. This leads to a decrease in classroom temperature and mitigates discomfort for the occupants. As stated previously, if a school classroom's internal temperature exceeds 28°C for 80 occupied hours, overheating has occurred. Our classroom only exceeds 80 hours in Simulation 1C. Simulation 2 has a maximum of 3 hours above 28°C, while all of Simulation 3 values are below 28°C. These simulations prove that by reducing ICT power, and therefore associated heat gains, overheating will not occur in our classroom model. Our model parallels of many of today’s school classrooms under construction. These results can be considered during the design stages of new schools, helping architects and engineers make informed decisions about ICT use and the effects it will have on overheating. If low powered ICT is used (such as future computers and tablets, 25 W and 5 W respectively), overheating in both summer and winter months should not become a problem in naturally ventilated classrooms.
Other Considerations
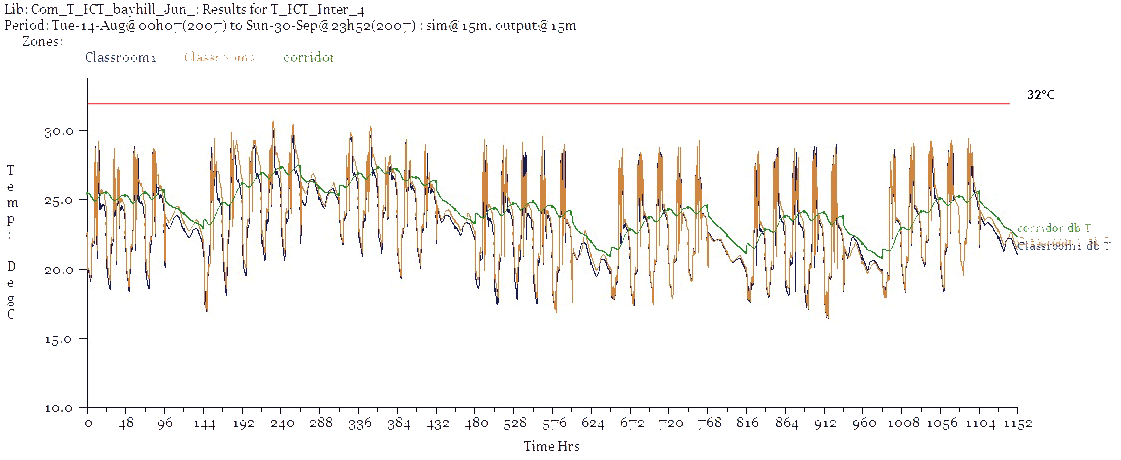
Until now we have focused on temperatures above 28ºC, however Building Bulletin 101 also states 2 out of 3 events must happen in order for overheating to occur. This includes the internal temperature rising above 5ºC difference from the external temperature and a space exceeding 32ºC when occupied. The graphs below address both issues. Graph 3 shows the internal versus external temperatures on a typical day in the defined overheating period (1 May- 30 Sep). The black line is the external temperature, the orange line indicates 5ºC above the external (the maximum allowable difference), and the blue line is the internal temperature. We can see that the 5ºC difference rule is not met and overheating may potentially occur.
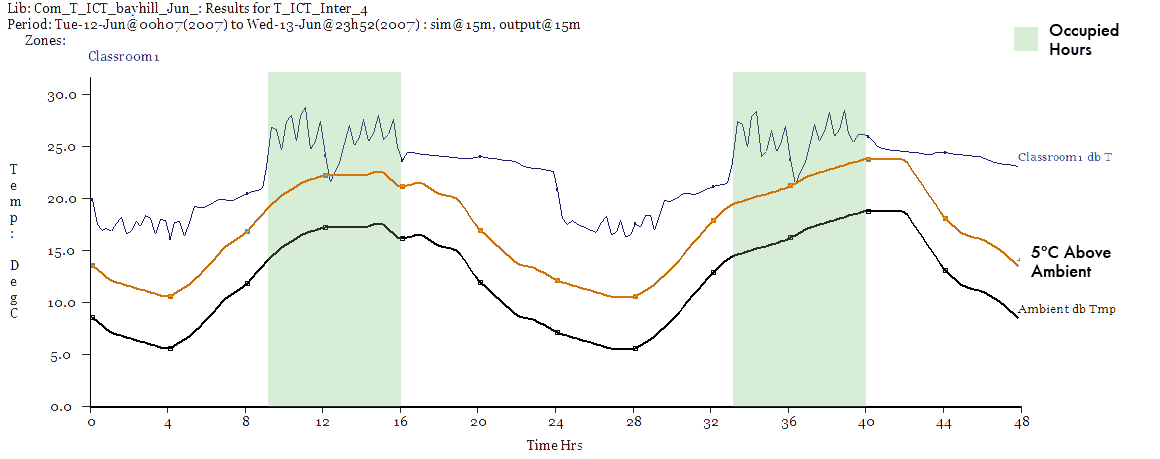
Graph 3: Internal vs. External Temperatures
Graphs 4 & 5 show that the classroom does not exceed 32ºC (indicated by the red line) at any point over the defined overheating period. The time period omitted from the graphs (14 June- 14 August) is the summer holiday.
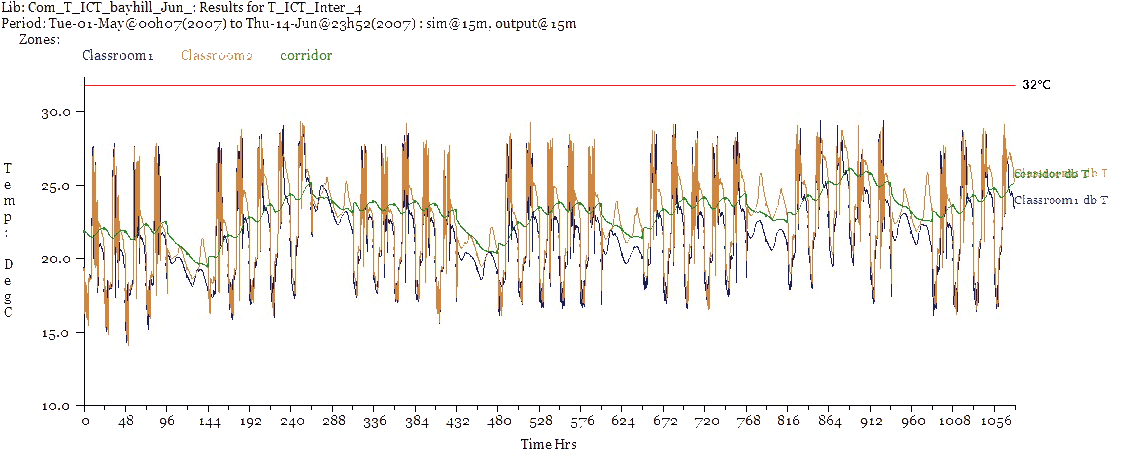
Graph 4: Hours Over 32ºC From 1 May-14 June
 Graph 5: Hours Over 32ºC From 14 Aug- 30 Sept.
Energy Consumption
For our model's purposes, the energy consumption is defined by the energy supplied to the heating only. We know the boiler efficiency of our case study is 85%, therefore the total energy consumption for the heating system will increase by 15%. This aspect is analysed in the carbon dioxide emissions page of this website.
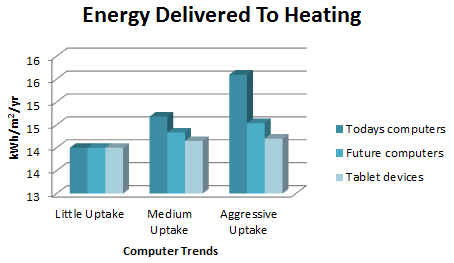
Graph 6: Energy Consumption
From Graph 6 above, we see that the aggressive uptakes in ICT trends always lead to the highest heating energy consumption. This is counterintuitive, as one might expect the heating needs to reduce as the heat losses of the ICT warm the room. An explanation can be found in human response. Recall that the windows in our model were scheduled to open when the temperature reached 25ºC. Because of the heat generated by the ICT in conjunction with the heat provided from the mechanical system, occupants overheat and open the windows. This will cool the room rapidly, resulting in a spiked graph between temperature and heating energy if plotted for one day, as Graph 7 below. In the relationship between these two parameters, we can see the first and larges peak in heating has the purpose of warming the classroom for the arriving pupils. However, once the opening and closing of the window commences, the heating spikes to compensate for the losses through air change out the window. This phenomenon ceases once the afternoon solar gains replace the role of the heating.
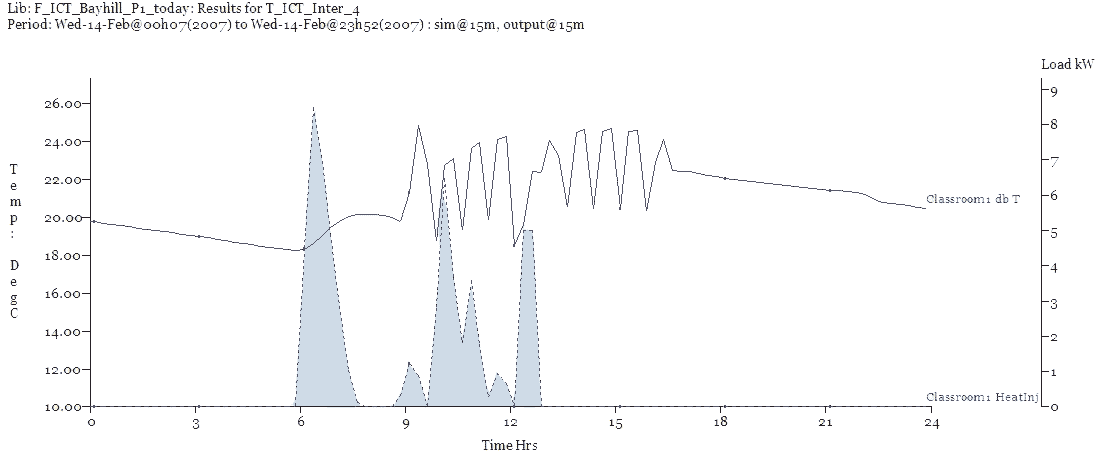
Graph 7: Temperature vs. Heating Energy Comparison Over 1 Winter Day
Energy consumption will vary with heating system. An investigation was conducted and is available in the sensitivity analysis section. Underfloor heating keeps the energy consumption more constant as its response time is much longer. A responsive system, such as radiators, can potentially allow occupants to consume more energy.
We also see that the trend between today's computers more dramatically increase as devices are added to the space. As tablets increase, the trend is more level. In the advanced model, this is an 11.4% increase in energy use for today's laptops, 2.84% for future laptops and 1.43% for tablets.