


Occupant Comfort Levels
Human thermal comfort is defined by the American Society of Heating, Refrigeration and Air-Conditioning Engineers (ASHRAE) as the state of mind that expresses the thermal comfort of occupants of buildings, within the surrounding environment. The thermal comfort of occupants is affected by heat conduction, convection, radiation and evaporative heat loss. Thermal comfort is maintained when the heat generated by human metabolism dissipates and maintains thermal equilibrium with its surroundings. Any variations out with this equilibrium, results in a feeling of discomfort.
The sensation of feeling too warm or too cool is not just dependent on air temperature alone. Other factors that determine thermal comfort include [1]:
- Personal Factors (health, psychology, sociology and situational factors)
- Clothing Insulation (‘Clo’ Units)
- Activity Levels (Metabolic Rate)
- General Factors
- Air Temperature
- Mean Radiant Temperature
- Relative Humidity
- Localized Factors
- Air Velocity
- Floor Surface Temperatures
Comfort Measurements Using ESP-r
The ESP-r modelling software package has theoretical comfort models built into it in order to analyse different measurements of thermal comfort. These models include the PMV (Predicted Mean Vote) of the thermal sensation scale, of a large population of people exposed to a certain environment and also the PPD (Predicted Percentage Dissatisfied Index), which is a quantitative measure of thermal comfort of a group of people in a particular thermal environment and each PMV. For the purpose of our analysis, we have decided to focus on the PMV comfort. [2]The PMV index predicts the mean response of a larger group of people according to the ASHRAE thermal sensation scale,[3] where:
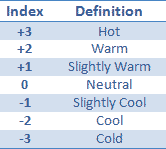
Table 1: Fanger Comfort Scale
Clothing Insulation
Before a comfort analysis can be carried out, two parameters must be confirmed. The ‘Clo Value’ is the first of these parameters. Based on the standard (ISO 7730), certain items of clothing have values associated with them, which can be added together and then multiplied by 0.82 to obtain the ‘Clo value.’ Examples of these values can be found in the table below.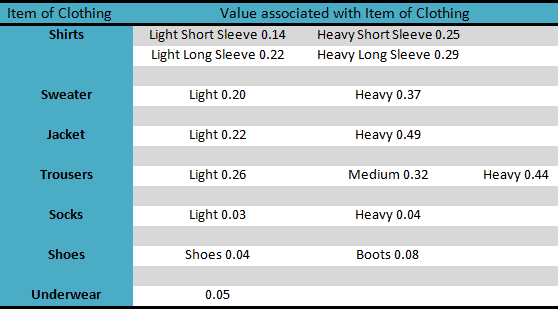
Table 2: "Clo" Values
In reality a different ‘Clo value’ would probably be used for the winter and summer periods, as the climate would determine what you would wear, but for the purpose of our analysis, a value of 0.69 was used for both periods for simplicity.
The second parameter that has to be defined is the metabolic rate. The metabolic rate varies depending on the activity the individual is involved in. For the purpose of our study we assumed a value of 1.1 (65 W/m2) as this is a classroom environment and this value indicates the occupant will be typing at a computer.
Intermediate Model Comfort Results
As part of our sensitivity analysis, we also decided to run the PMV analysis on our Intermediate Standard model. The results can be found in Figures 1-3 below. The most obvious difference between the results obtained for the Intermediate model in comparison to the Advance Standard model was that, in the winter the ratings range from: ‘Slightly cool, Acceptable’ to “Comfortable, Pleasant.’ As a whole the results follow the same trends as the advanced model.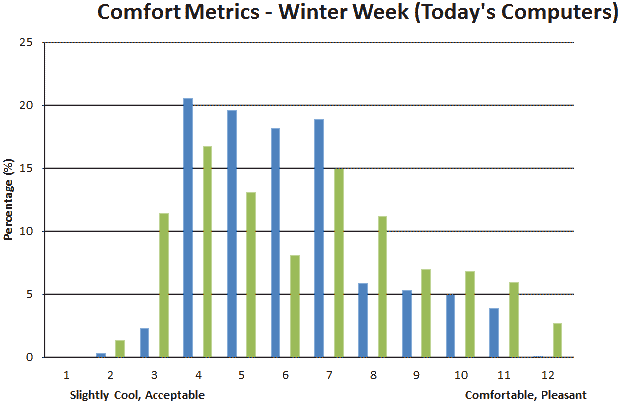
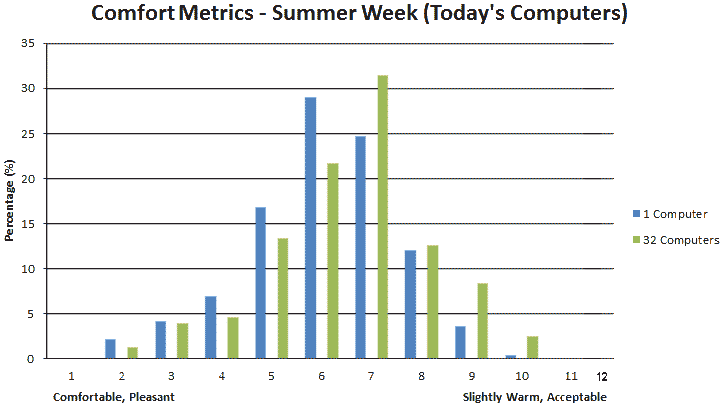
Figure 1: Comfort Metrics For Today's Computers
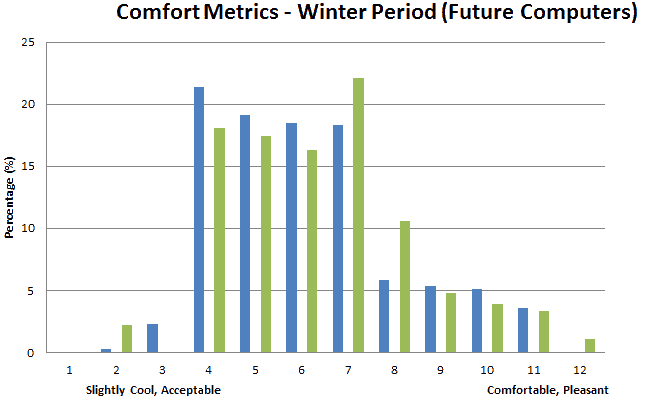
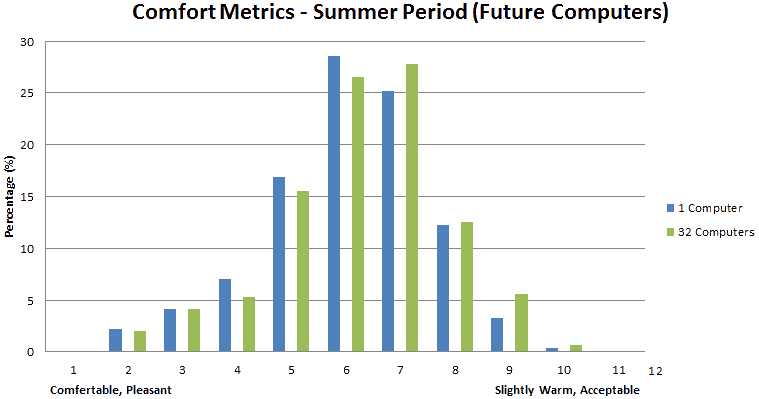
Figure 2: Comfort Metrics For Future Computers
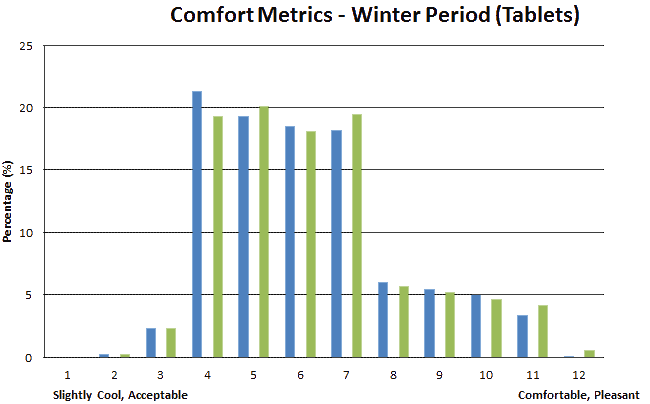
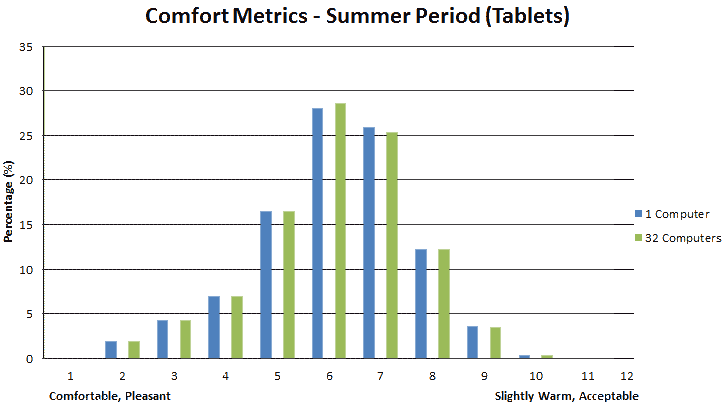
Figures 3: Comfort Metrics For Tablets
Advanced Model Comfort Results
The results of our investigation can be seen in the graphs in the three figures below. The analysis was carried out over a typical winter and summer week for today’s and future computers and also for tablets.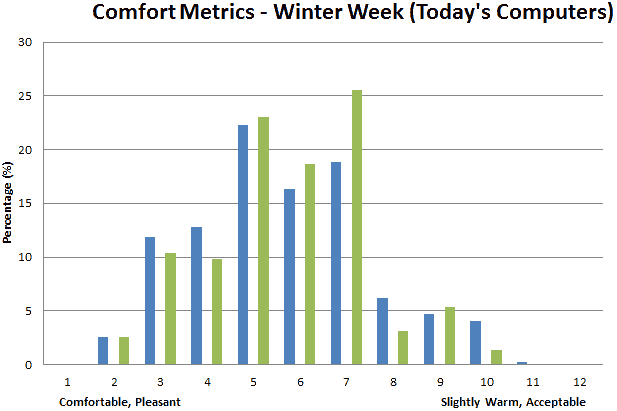
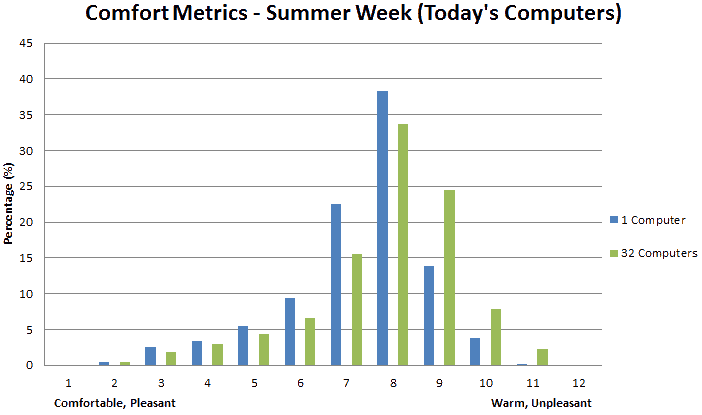
Figure 4: Comfort Metrics for Today’s Computers
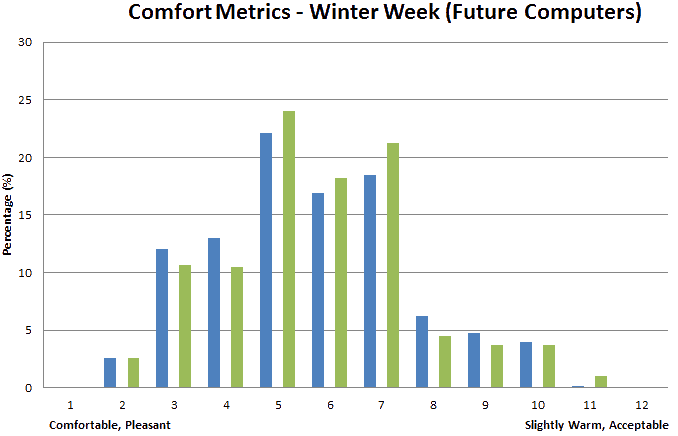
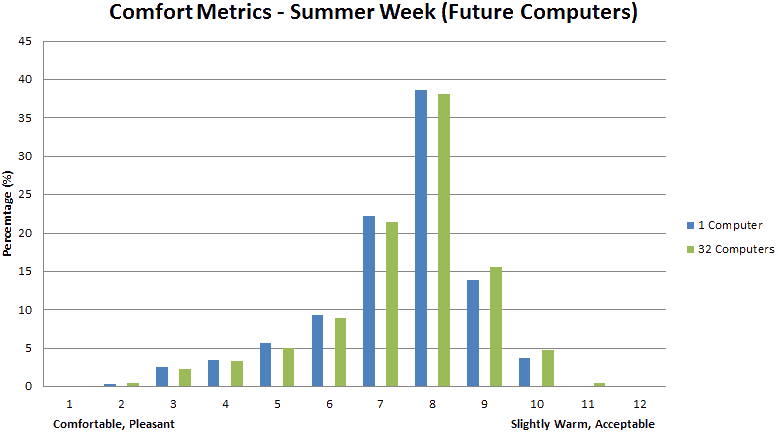
Figure 5: Comfort Metrics for Future Computers
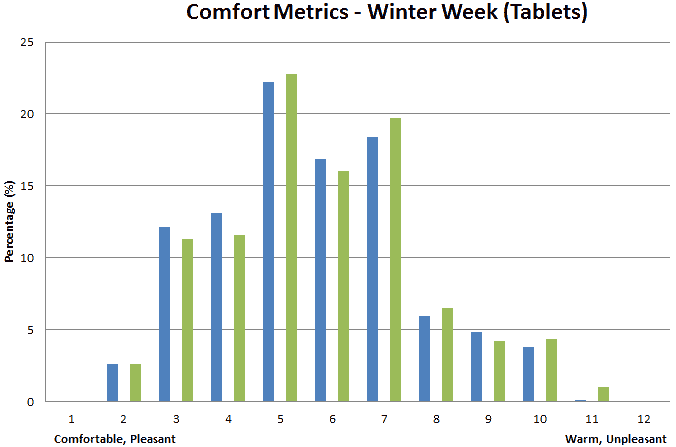
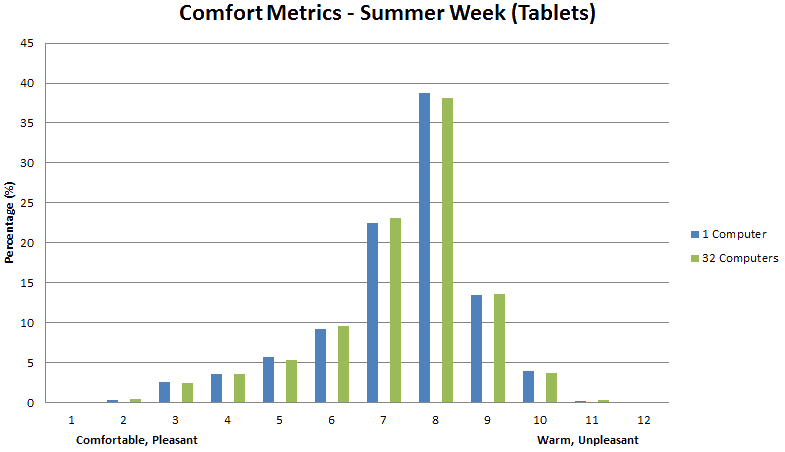
Figure 6: Comfort Metrics for Tablets
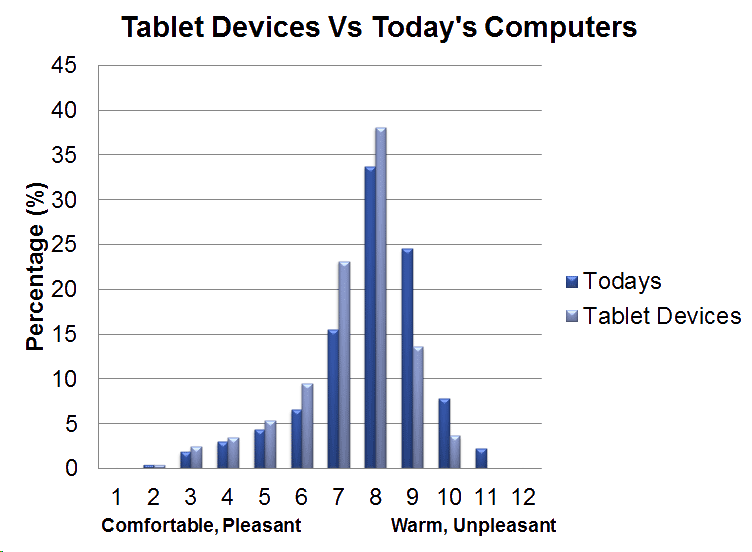
Figure 7: Comfort Metrics Comparison
From the results obtained, it can be seen that the level of comfort experienced by the occupants, most of the time ranges from ‘comfortable, pleasant’ to ‘slightly warm, acceptable’. The most obvious deviation from this is the comfort levels associated with the increase in use of today’s computer in the summer period. As the number of computers is increased from 1 to 32, the PMV analysis shows that the comfort begins to lean more towards a warm, unpleasant rating. The results from Figure 5 suggest that the computers of the future would not cause much of a problem to comfort as the PMV rating states that for most of the time, the occupant would be slightly warm, but acceptable. The same result could also be taken from the analysis using tablets. The main observation from the use of tablets was that the comfort ratings do not really change as the number of devices being used increase. This is due to the low rating of the appliance.
[1] http://www.hse.gov.uk/temperature/thermal/factors.htm
[2] http://www.engineeringtoolbox.com/predicted-mean-vote-index-PMV-d_1631.html
[3] http://www.esru.strath.ac.uk/Reference/concepts/thermal_comfort.htm