The next area to explore was the choice of suitable turbines for this location. A selection of the turbines considered is shown in Table 1.
Turbine |
Rated Power (kW) |
Hub Height (m) |
Diameter |
Expected Annual Yield (MWh) |
Rough Cost (£) |
Proven 35 |
15 |
15 |
9 |
21.5 |
46,000 |
Nordex N50 |
800 |
46 |
50 |
995 |
~1,000,000 |
Vestas V80 |
2000 |
60 |
80 |
3,500 |
2,400,000 |
Vestas V90 |
2000 |
80 |
90 |
5,380 |
2,500,000 |
Table 1: Turbine options
The expected output for the turbines in this location was modelled using Merit, Windpower and Rayleigh Distributions. The outputs from each program were then evaluated to obtain an estimated output. The input data was taken from the Merit database and from the manufacturer’s datasheets. A snapshot of the WindPower tool is shown in Figure 1.
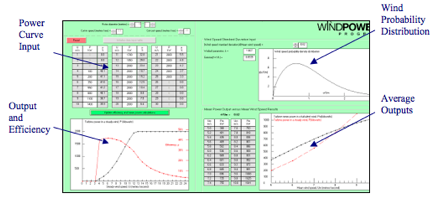
Figure 1: Snapshot of Windpower program
Firstly, the small scale Proven turbine was considered. This turbine generates quite a small yield, so multiple units would be required for any significant output. However, there is limited space on this high ground and multiple installations would increase turbulence in this relatively small site.
Hence, the next consideration was for a larger turbine. The turbine in consideration was the Nordex N50. A significant increase in the expected yield can be seen with this turbine.
However, if an even larger turbine was utilised the output could increase five fold. The Vestas V90 is effectively a V80 with longer blades, thus allowing for greater generation in medium or low wind locations as it has a steeper power curve. It was modelled to produce over 5GWh of generation per annum, which would make a significant contribution to the community’s electricity consumption. This would be equivalent to around 250 15kW turbines. So for the purpose of this case study, the Vestas V90 was chosen.
With increaseing turbine size, this in turn produces greater issues with noise and safety. The Vestas machines can be operated in a low noise mode, but this would have a small adverse effect on the output. Although faults in turbines are rare, there would be significant increases in safety concern for an urban location. Large scale urban wind can be feasible, however, as other projects have shown. Stankovic et al . highlights 2MW turbines at urban sites in Reading and London.
Should the size of the turbine be a limitation due to safety or noise reasons then the N50 could be utilised in its place, although this obviously produces a significantly smaller output.
An image of the proposed site is shown in Figure 2.
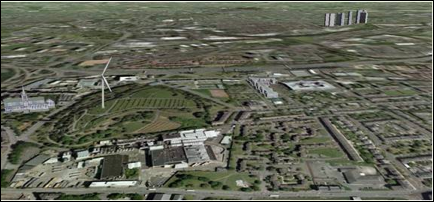
Figure 2: Image of proposed turbine installation
As this site is close to the industry in the area (Tennents Wellpark Brewery) then a direct connection could be considered. The current consumption of the Brewery is around 20GWh, so a turbine of this size could produce around a quarter of the current demand.
When assessing the benefits of local generation, the effects of electrical transmission should be considered. In this case, the transmission losses of electricity generated outside of the city, at Whitelee wind farm, were compared to that of local generation. The following assumptions were made from Rating of Electric Power Cables .
Line (kV) |
Resistance Ω/km |
Transformer Efficiency |
400 |
0.067 |
99 % |
132 |
0.11 |
|
11 |
0.5 |
Table 2: Transmission assumptions
From these assumptions, a spreadsheet of distances was created using the existing transmission lines and assuming transformers at each linkage. The transmission losses for the Whitelee site to the inner city consumption were found to be around 7%. This consisted of 15km of 400kV, 15km of 132kV and 3km of 11kV lines with transformers to step up and down voltages.
Whereas for the local generation, using 0.2km of 11kV lines, one step up transformer and a direct connection to the brewery, the losses were found to be only around 2%. Thus, there is a 5% reduction in electricity lost in transmission. The results for the long distance transmission tie in with figures from the National Grid’s Seven Year Statement. As expected, most of the losses were seen to occur at low voltage transmission.
The set up for the turbine connection is likely to be constructed as follows;
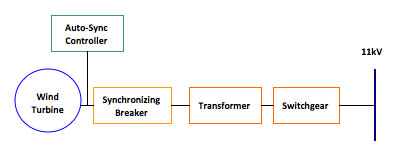
Figure 3: Turbine grid connection configuration
The output for the urban site is expected to be less due to the lower quality wind resource. Another comparison was made, this time to the possible output from the same turbine situated at the Whitelee wind farm. The average wind speed was higher and the expected output was found to be 25% greater.
In conclusion, the urban site is expected to be 20% less efficient. However, the possible projected output could still be economically viable. This can be seen in the Economics section.