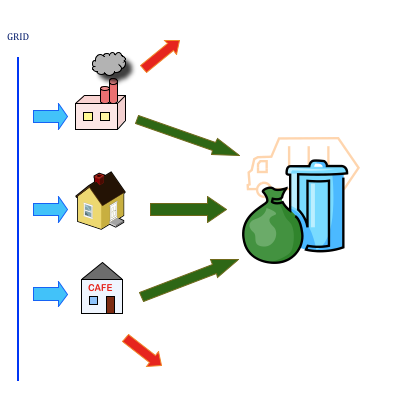
Figure 1: Initial Community Energy Flow
This flowchart highlights the linear flow within the existing community. The different buildings within the community are independently consuming power from the grid. Whilst being consumed, there is significant amount of energy wasted as heat, or lost through inefficient heat retention. Most waste from the community is transported away to be processed. This is true for human waste, household waste and industrial waste.
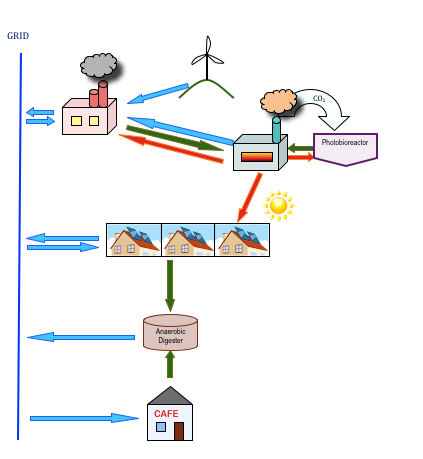
Figure 2 – Improved Community Energy Interactions
With a reassessment of the building interactions within the community, and the application of different schemes, the following outcome can be seen in Figure 2. Here, there is significantly more interdependence and the linearity of the flow has been reduced. There is now a greater utilisation of the waste within the area.
The brewery is now powered primarily by the biomass boiler CHP system. The heat from this system is also used primarily for the brewing process, with excess heat used in the local social housing estate and to aid the growth of the algae. A proportion of the peak electricity use for the brewery is covered by the wind turbine, and any excess electricity is exported back to grid. The spent grain from the brewing process is used to fuel the biomass boiler. The boiler also uses microalgae from the photobioreactor as fuel. A proportion of the carbon dioxide emissions of the biomass boiler are absorbed by the microalgae during its growth cycle. The south facing roofs of the tenement blocks within the area are fitted with solar power systems which allow consumption on site and a proportion of power exported back to the grid. Human and food waste from housing and commerce within the area is fed to an anaerobic digester, which produces a biofuel that can be used to produce power that can be exported back to the grid.
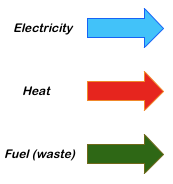
Figure 3 – Energy Flow Legend