Large Scale Results
Following the in-depth analysis of the Scottish residential building stock, the retrofits for individual buildings can be aggregated to represent the whole building stock. All of the results that follow represent the entire modelled building stock.
The core aspect to consider here is the total energy demand. The following graph shows the total annual energy demand for the whole building stock. The first bar represents the energy demand of the current building stock as modelled in HEM. The remaining 14 bars show the energy demand of each of the retrofit levels when applied to the whole building stock, with the retrofit category notation specified below each bar.
The core aspect to consider here is the total energy demand. The following graph shows the total annual energy demand for the whole building stock. The first bar represents the energy demand of the current building stock as modelled in HEM. The remaining 14 bars show the energy demand of each of the retrofit levels when applied to the whole building stock, with the retrofit category notation specified below each bar.
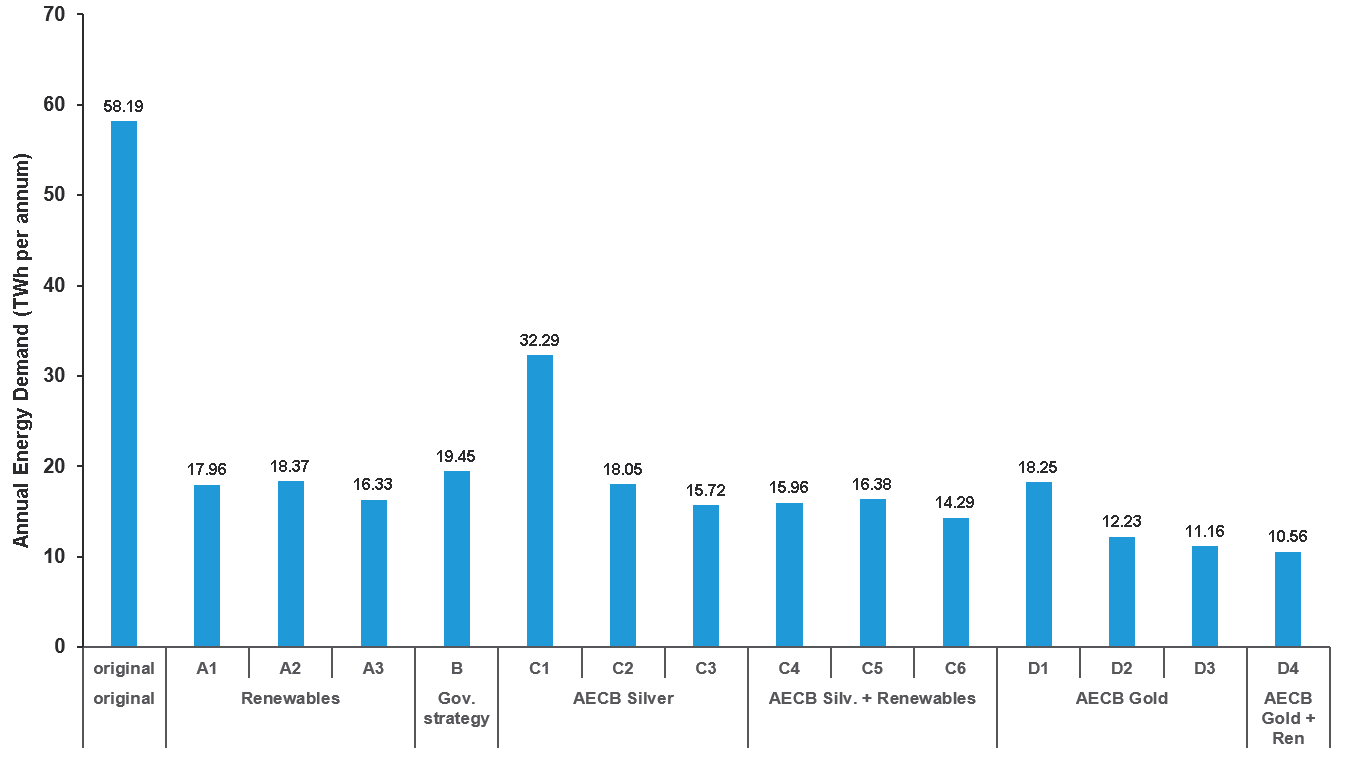
Figure 1 -Annual Energy Demand for Retrofit Levels
A clear reduction in demand can be seen from all retrofit levels. The percentage demand reduction from each of the retrofit categories is described in the following table:
Retrofit Category |
Measures Involved |
Energy demand Reduction (%) |
No fabric improvement (A) |
HP, solar renewables |
70 |
Government (B) |
Basic insulation, HP |
66 |
Silver (C, excluding C1) |
Moderate insulation, MVHR, HP, some with solar renewables |
72 |
Gold (D, excluding D1) |
Super insulation, super MVHR, HP, solar thermal, one with solar PV |
81 |
As expected, the largest demand reduction occurs with the deepest retrofit. The majority of the demand reduction occurs with the use of a heat pump, present in most retrofit levels. For this reason, retrofit categories C1 and D1 were not included in the figures above. These levels use a gas boiler, which operate at significantly lower efficiencies than heat pumps resulting in a notable increase in the energy demand. The Coefficients of Performance (COPs) used in the modelling are the values inbuilt into HEM. For an ASHP, the values are 2.5 for heating and 1.58 for hot water heating. For a GSHP, it's 3.2 for heating and 2.02 for hot water.
The silver and gold retrofits using gas boilers still achieved significant energy saving of 45% for the silver standard and 69% for the gold standard. This is due to a combination of the fabric modifications as well as improvements in the efficiency of the gas boiler.
Another point of interest is the comparison between deep retrofit and the government standard (a comparatively shallow retrofit). While the graph above shows a relatively small difference in demand between the two approaches, the silver standard achieves a 19% lower demand when compared to the government category, and the gold standard achieves a 57% lower demand. This added demand reduction could play a vital role when the whole energy system is taken into account, which will be discussed further in the Scenario section.
CO2 is an important aspect of the Government strategy, with the aim of having a wholly decarbonised electricity grid by 2050. The CO2 emissions modelled follow the same trend as the energy demand, as shown in the figure below.
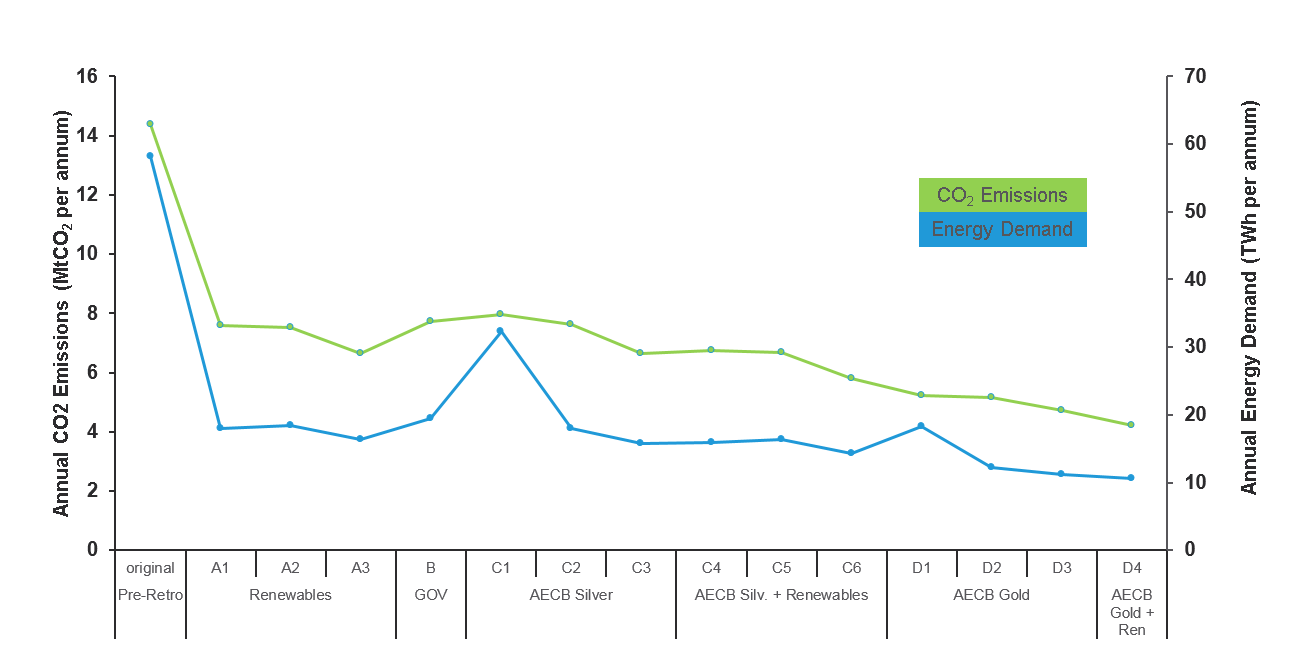
Figure 2 - Annual CO2 Emissions and Annual Energy Demand trends
In terms of cost, our information is based on the built-in HEM database. The costs within this tool were derived from a Scottish Government study conducted in 2010 and have since been verified through collaboration with a local authority and found to be realistic. Since there hasn’t yet been a large-scale deep retrofit scheme, there will always be some degree of uncertainty regarding cost.
As can be seen in the graph below, there is a clear trend of cost increasing as the retrofit becomes deeper. The findings also show that adding PV results in a somewhat sizable cost increase as with A2, A3, C5, C6 and D4. However, using newer PV costing data may show a less visible trend. The graph shows that there are two notable low-cost approaches - A1 and the Government strategy. These are both relatively shallow retrofits that still result in a large energy demand reduction, as shown in figure 1, suggesting that they are cost effective options.
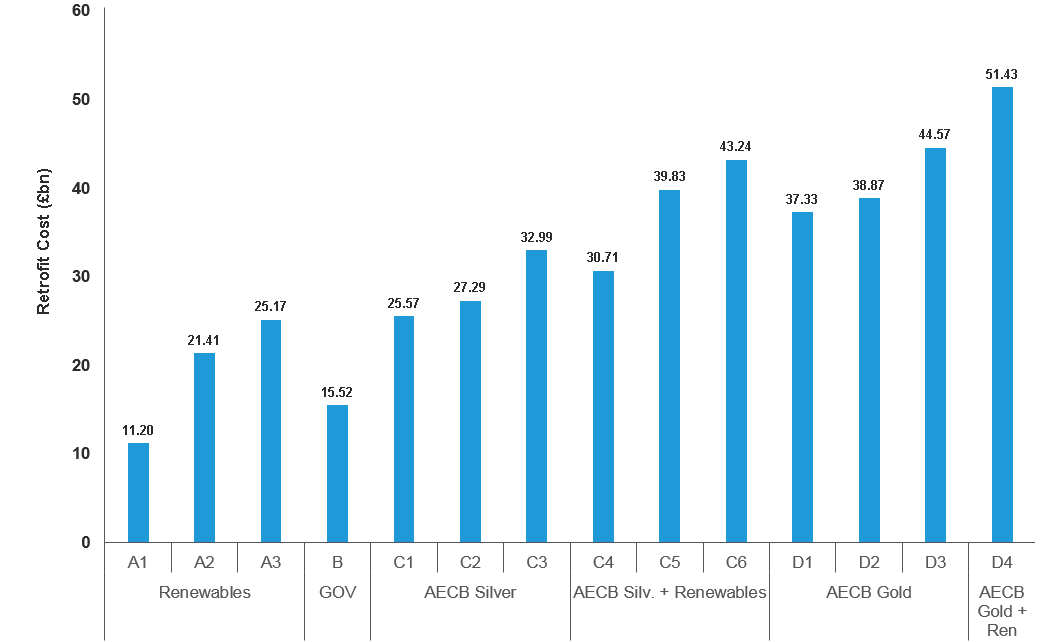
Figure 3 - Retrofit Capital Costs