Financial Analysis & Carbon Saving Results and Conclusion
When considering the economic feasibility of each technology there are several parameters which must be calculated in order to determine which is the most economically practical. Firstly, the magnitude of the energy saving was considered for each technology outlined in the table below in which we find that the steady tilt shading system has the biggest reduction in energy consumption.
Energy saving unit of each model (kWhr/year/ room 6m x 8m) compared to the base case model
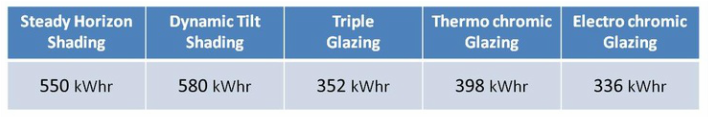
Table 1
The energy saving of each technology was then translated into the associated cost saving , shown below in table 2. With the maximum energy saving per year the dynamic tilt shading system would save the occupant approximately £81 per year by implementing this system.
Energy Saving Cost (£/year/ room 6m x 8m)
The Energy Saving Unit is multiplied by the Electricity Cost per Unit (0.14 £ / kWhr)*
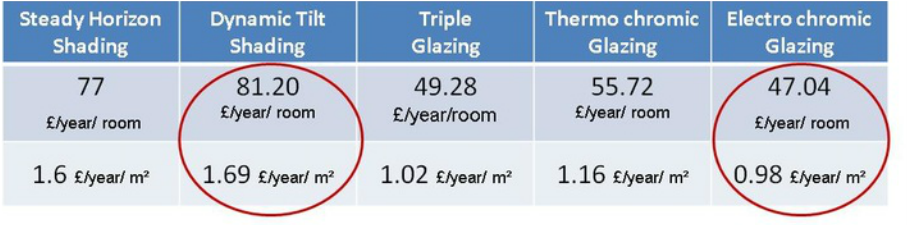
*(http://www.energysavingtrust.org.uk/content/our-calculations)
Financial viability is not limited to mere energy savings. The capital cost of each of these systems must also be considered to determine whether or not each technology is economically practical. Table 3 highlights the capital cost of each of these technologies and the values used to calculate these. From table 3 below it can be shown that there is a significant difference between the cheapest of these technologies and the most expensive. The steady horizontal shading system is the cheapest at £795 for a shading system designed for our base case model while the electrochromic glazing is the most expensive of the technologies by quite some margin at approximately £2328.
Capital cost of each model (£/ room 6m x 8m) come from the
average capital cost of 3 different product or companies*

Table 3
*The average capital cost of product come from
•Tata, Dexone, Prolouver, SDP (http://www.alibaba.com/product-detail/Aluminum-louver-solar-shading_1861272021.html),
•Glass Magazine (http://glassmagazine.com/article/commercial/dynamic-glass-offers-growing-revenue-stream-118960)
•Alibaba Global Trade(http://www.alibaba.com/product-detail/High-Quality-PDLC-Switchable-Glass-electrochromic_60222487497.html,).
Table 4 below shows the associated payback periods and internal rate of return for each technology. The shortest pay back period is achieved by the steady tilt shading system at just over 10 years with a internal rate of return of 13.5% while the electrochromic glazing has a lengthy payback period of almost 50 years which is considerably more than the steady tilt shading system. The electorchromic glazing also has the shortest guarantee out of the technologies which may mean it is not expected to have as long a lifespan as the others.
Pay back period of each model (years/ room 6m x 8m) & Internal rate of return.

Table 4
From the results outlined above it is clear that the steady tilt shading system is the best value for money with the highest energy saving costs and relatively low upfront capital cost. It is also the technology with the highest rate of returns. Lastly, we must too consider the carbon saving rate of each technology. The dynamic tilt shading system came out on top with the largest saving of around 107 kg/year/room. This compares with electrochromic which had the lowest carbon saving, with just over half of what the dynamic tilt shading had.
Carbon Saving Rate of each Technology

Table 5
Overall, the energy performance and the energy saving costs were better for the shading models than for the glazing models. The steady horizontal shading model had the lowest capital cost and smallest payback period while the dynamic tilt shading system had the highest carbon saving rate and the highest energy saving cost and so environmentally and economically these are the most practical of the technologies tested.
The financial statistics found for thermochromic and electrochromic glazing are not satisfactory enough to make this economically viable because the technology is still new and is still under development. However, it has been predicted that the cost of this technology is set to decrease by as much as 70% over the next 10 years and with the technology continually advancing this may become a competitive technology in the not too distant future.
The financial statistics found for thermochromic and electrochromic glazing are not satisfactory enough to make this economically viable because the technology is still new and is still under development. However, it has been predicted that the cost of this technology is set to decrease by as much as 70% over the next 10 years and with the technology continually advancing this may become a competitive technology in the not too distant future.