- Introduction
- Tidal Energy
- Resource
- Constraints
- Phasing
- Economic Analysis
- Conclusions
- Downloads
Tidal Phasing
Methodology
Choosing Suitable Sites
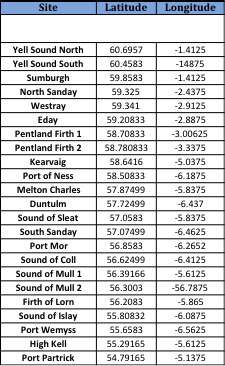
The areas that were chosen to investigate the viability of phasing in Scotland were those with significant area left over after policy and technical constraints were applied to Scotland's tidal resource. These areas were considered if they had an average spring velocity of greater than 2m/s according to our analysis. Some viable areas were discounted as it was not possible to calculate velocity profiles from the Tidal Stream Atlas data. Overall 23 viable areas for tidal phasing were identified across Scotland, the name and location of these is shown in the table below.
Creating Power Profiles
In order to calculate the power output for a given site the velocity at a specific site had to be calculated. The information required to calculate the velocity at a specific time at each site was taken from Admiralty Tidal Charts Atlas'. As this study was looking at tidal areas in Scotland the atlas numbers studied were NP 209 and NP 218 for the North and West Coast of Scotland. Tidal Charts give the velocity for spring conditions and neap conditions for 6 hours before high tide at Dover and 6 hours after high tide at Dover.
For the purposes of this study it was assumed that the month began with spring conditions, which degraded over a 7 day period until neap conditions which rose up to spring conditions again over a 7 day period;, this cycle was then repeated in order to get a monthly velocity profile for each site.
What our study found during this analysis was that the data from the Tidal Admiralty Charts was area specific as opposed to being site specific. In order to account for this problem we assumed the tidal distribution was the same for a given area and that the velocity changed within this area. We used tidal data for average spring velocity and neap velocity from the Proudman Oceanographic Institute ,whose data was accurate to one square kilometre, to populate the Tidal Phasing Tool. The tidal phasing tool allows users to choose velocity data from Tidal Admiralty Chart, data from the Proudman Oceanographic Laboratory or to enter their own data for a pre-defined area.
This velocity was then used to calculate the maximum power output for a specific site by using the equation for the maximum theoretical power extractable from a turbine.
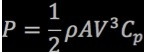
This power was then limited based on the rated power power of the turbine deployed at each site.The tidal phasing tool give the user the ability to change the number of turbines,turbines rated power output,rotor diameter and performance coefficient (Cp) in order to suit their own preferences.
Finding the Best Phasing Combination
In order to find the best phasing combination of those 23 sites we used the tidal phasing tool that was developed over the course of this project. The analysis of this is covered in Phasing Results.