- Introduction
- Tidal Energy
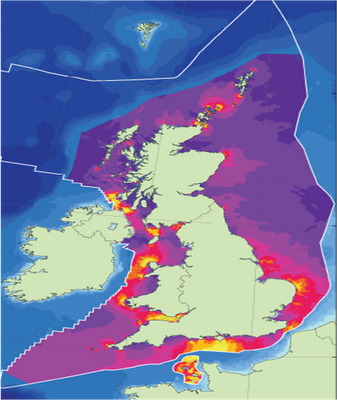
- Resource
- Constraints
- Phasing
- Economic Analysis
- Conclusions
- Downloads
GIS Software
GIS Mapping Software
Geographic Information Systems (GIS) is a useful software tool that can be used to present a variety of data on a geographical map. GIS mapping techniques are a common method used to analyse, manage and display a variety of information and are used by national governments, scientists, environmental and conservation groups on a regular basis. There is a number of different GIS software packages available on the market with the most popular industrial packages being ESRI ArcView and ArcGIS .
GIS mapping techniques have been used in this project to analyse to what extent policy and technical constraints limit Scotlands tidal power resource. GIS software was utilitised in this project as it enables the user to geo-reference and overlap multiple sets of data. By overlapping the constraints data computed in this project it allowed us to identify tidal regions in Scotland that were affected by policy and technical constriants.
For the purposes of this project localised tidal regions around Scotland that have been determined to yield the greatest potential, will be analyzed more thoroughly.
Quantum GIS
The program chosen for this study is Quantim GIS (QGIS), an open source desktop geographic information system application. QGIS allows users to input, modify and display data for analytical purposes, and is freely available to download. The latest version of the software is Quantum GiS 1.6.0-Copiapo and this version of the software can run on Windows, Linox and Mac OX operating systems
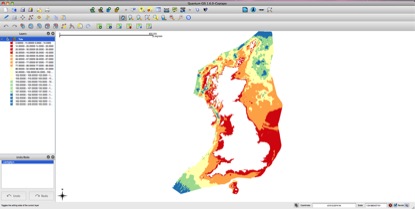
The type of files that have been mainly used, those compatible with QGIS, are called "Shapelayers" which end in a .shp extention. The user can create a shape layer file by either entering the information through an Excel based database file (.dbf) or by creating a database file through plotting the information in to the software.
Each data set introduced in the shape file layer is unique and either takes the form of a vector layer (Shape Layer) or a raster layer (Picture Layer). Once a shapefile layer is finished the user can create a project file with multiple shapefile layers. By using the graphical interface these layers can be turned on and off by the user depending on what information they require to be displayed.
IMAGES:
[1] Department for Business Enterprise and Regulatory Reform (BERR)-Atlas of UK Marine Energy Resources (2007)
Available at: http://www.renewables-atlas.info