Reduced Flow Temperatures
The West Whitlawburn district heating system current operates at a supply temperature of 85°C and supplies space heating and hot water to its users. Improved system efficiency can be achieved, however, through the reduction of the supply temperature resulting in lower heat losses. The potential impact of the reduced flow temperatures in terms of heat losses can be explored utilizing the newly developed West Whitlawburn district heating model. To do so simulations were run over the course of three weather diverse months. First with a reduction in supply temperature to the absolute practical minimum the installed system can operate at, and secondly to explore the impact of the growing district heating topic of 4th generation temperatures.
It was found from the data gathered during the site visits, that the minimum practical operating supply temperature, due to the size of the installed radiators and heat interface units, at WWHC is 70°C. Simulations at this supply temperature were conducted over the months of July, October and December and the results are presented in Figure 1. Analysis of the results revealed that the potential for a 21% reduction in heat losses could on average be achieved by operating at a supply temperature of 70°C. From the validation section it was highlighted that the heat losses are independent of the return temperature and flow rate, bringing confidence with these results as the supply temperatures were the only controlled parameter.
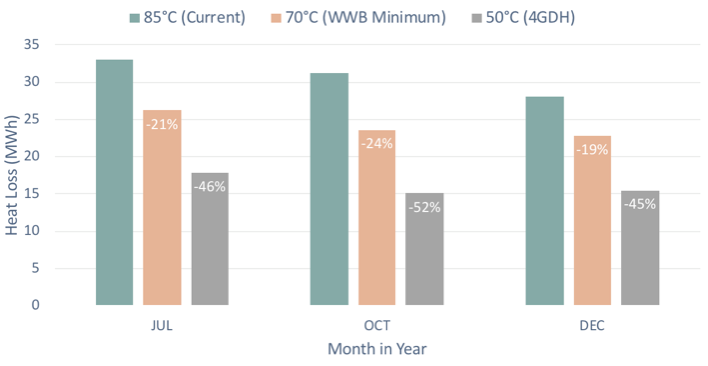
Figure 1: Reduction in Losses with Reduced Temperatures
A growing topic in sustainable district heating system is in fourth generation district heating. Fourth generation district heating systems operate a reduced flow temperature of 50°C, and new research has shown substantial heat loss savings as a result of improved efficiency. In doing so simulations were ran over the equivalent three months and results suggest that losses could be lowered by up to 52% for the month of October with an average reduction of 47%. Not only does this correspond to lower operational costs, calculations estimate that annually this could reduce CO2 emissions by 7.5%, or 2.3 tons of carbon dioxide being eliminated for the production of the heat.
This was calculated by viewing July, October and December as representative of all summer, autumn/spring and winter months respectively, as shown in the equation below. The potential reduction in energy losses was calculated and this was transformed into a percentage reduction in the required heat input to the system annually.
- Annual Saving = 3*Jul_Saving + 6*Oct_Saving + 3*Dec Saving
- %_reduction = Annual Saving/Annual Energy Input
Further to this investigation a study was conducted to explore the breakdown of the heat losses, in terms of the areas of the network. Results from the study are highlighted in Figure 2, where it is revealed that the majority of the heat losses in the model occur in the branches to the towers. These have significantly larger demands than the terraces and are relatively long sections of pipework as shown in the pipe distribution layout schematic previously. Interestingly the lowest heat loss in the system come from the main distribution line however this is likely due to its short length.
Results realised in this study are true for each of the reduced flow temperatures whereby the percentage contribution of each area of pipework to the overall losses were the same. A further study may use the model developed to investigate whether the pipe sizing is correct and whether the Energy Centre is optimally located in the network.
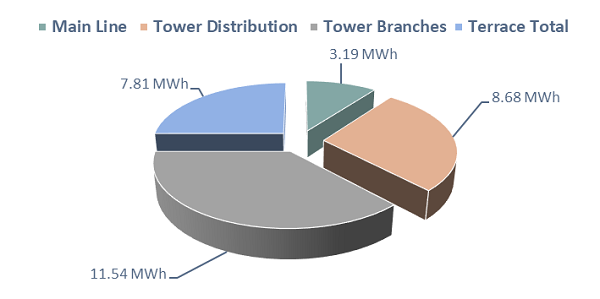
Figure 2: Breakdown of Losses
Thermal Store Size
During the data gathering and analysis phase of the project, it was found that during long periods in summer the thermal store was being under-utilized and appears to be oversized. In order to investigate this issue further, the new district heating model was utilized and simulations using four reduced thermal store sizes across a two-day period during a summer month were run. As the modules used in the software, especially the thermal store module, are still under development, this investigation allowed the possibility to test the modules and explore the extent of any limitations.
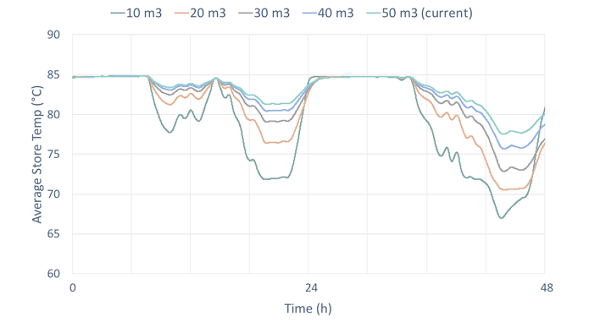
Figure 3: Impact of Store Size
As shown in Figure 3, all thermal store sizes follow the same trend, highlighting that the size has minimal impact on the overall store operation. Level sections of the plot are periods when the store is fully charged, highlighting that the model thermal store, as with the actual system, is being underutilized. What is evident from the undertaking of this investigation and the results is that ESP-r is capable of conducting these investigations. However improvements in the thermal store module are required in order for future investigations to be accurate and reliable. Further development of the thermal store must include active control in order for future detailed studies into the optimal thermal store size and operation to be conducted.