Introduction
Since the co-operative's formation, they have appreciated the need to upgrade the tower blocks as they aged and began to decay. Many buildings from the 1960s, such as these, have central constructions that are robust and have undergone internal refurbishment, however many retain their original building exterior which is badly insulated, visually unattractive, has high heating and maintenance costs, and high carbon emissions.
Tenants were suffering from problems including water ingress from the roof and walls, falling windows and deteriorating balconies. This was having a detrimental effect on residents' health and living conditions. With increasing maintenance work costs, and temporary work having little effect towards solving issues, it was evident that major work would have to be undertaken to extend the life of the buildings and improve tenants living conditions.
The development involved the design and installation of aluminium rainscreen, curtain walling, balcony enclosures, replacement windows, steel extension roof and roof cladding to the six tower blocks. The aluminium cladding system is comprised of inert, solid aluminium panels with mineral wool insulation and fire breaks that are non-combustible. Figure 1 shows a tower block before and after the project, and Figure 2 shows the balcony area before and after enclosure.
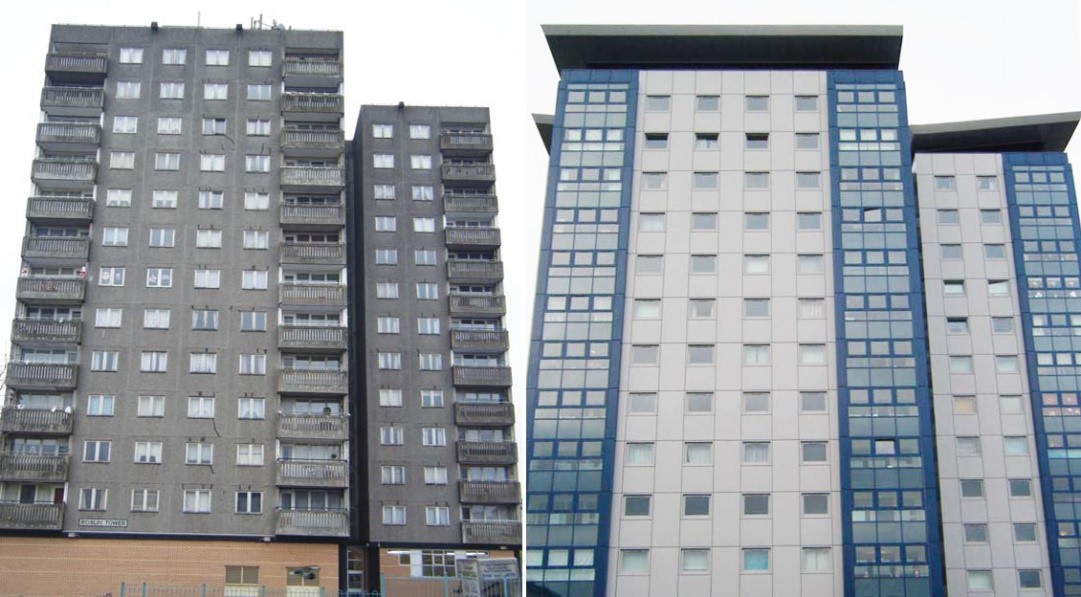
Figure 1: Before and After Cladding
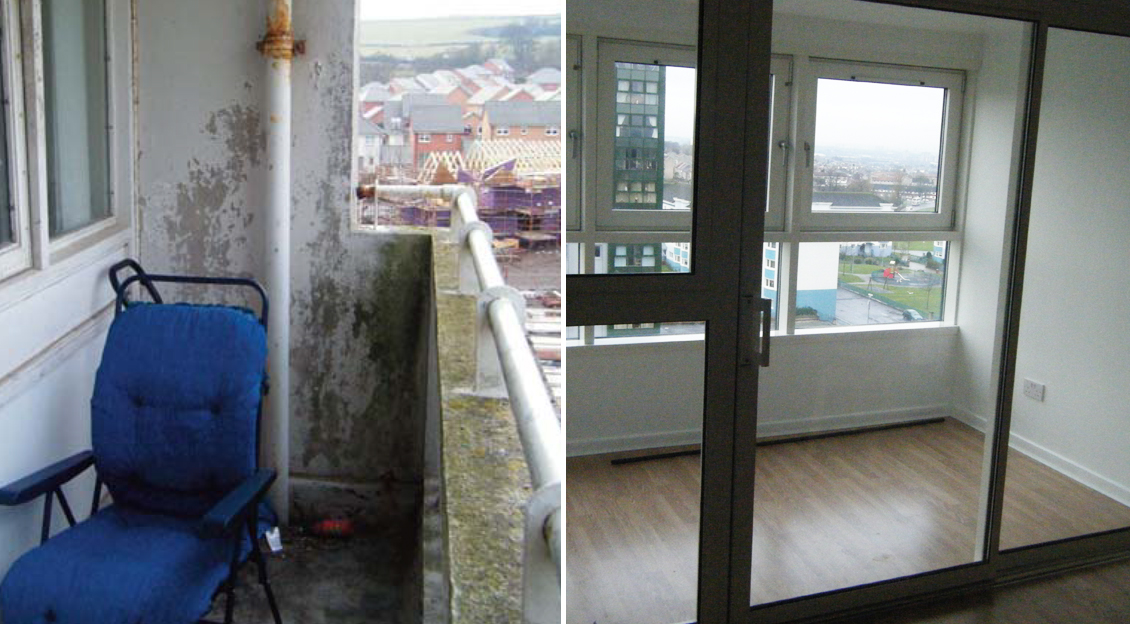
Figure 2: Enclosure of balconies
The aim of the upgrades was to improve the thermal performance and air tightness of the buildings. The U-values and other thermal characteristics of the clad walls, roofing and double glazing are reported to be:
- External walls: 0.27 W/m2K
- Roof: 0.16 W/m2K
- Glazing U-value: 2.0 W/m2K
- Frame U-value: 1.3 W/m2K
- Effective Air Leakage: 0.00 W/m2K
- Solar Energy Transmittance: 0.43
Thermal Site Investigation
Despite the extensive upgrades carried out by, WWHC some residents have still been reporting thermal discomfort. WWHC were eager to have a thermal investigation carried out to identify any noticeable issues or areas for improvement. On a site visit, this was carried out as part of this project. Access was granted to three high-rise flats occupying different positions within the towers on a cold evening when the residents were likely to be using their heating.
Thermal imaging with an IR camera was used as the primary investigation method. Images were taken of all the building envelope (walls, windows, floors and ceilings) and locations of likely thermal bridging i.e. window frames and room corners. In addition the dry bulb temperature and relative humidity of every room visited were also recorded. In the following, several thermo-graphic images are presented and discussed.
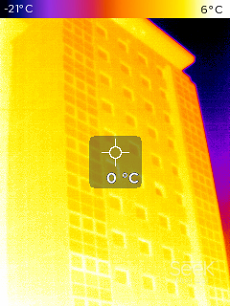
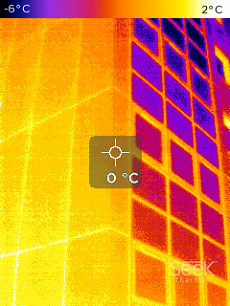 Figure 3: External Cladding on Arran 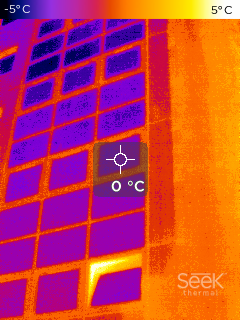
|
|---|
The external cladding on Arran Tower was investigated for any notable hot spots indicating heat escaping from the interior. The left hand image of Figure 3, shows no obvious areas of specific heat leakage across the whole tower facade. (The brighter area to the bottom left is due to street level lighting). The glazing seems to be at a lower temperature than the cladding. However, the other two images of Figure 3 evidence that, although apparently colder they are in fact also at 0°C. This is the temperature that all bar two of the external images indicated. These images are strong evidence that the cladding and windows have improved the overall thermal performance of the tower blocks with no obvious defects.
The building envelope was investigated from within each of the visited properties as well. Some of these images from an 8th floor property are shown in Figure 4. The three images (l-r) are of the main external wall, main window and wall/floor of the lounge. The room temperature at the time was 19.9°C. The wall and floor had a fairly uniform temperature of 17°C, however a small amount of thermal bridging is apparent around the corners of the room where the temperature is 16°C. The window has a temperature of roughly 11°C and the frames are a degree warmer. This is a worrying temperature region where condensation may occur.
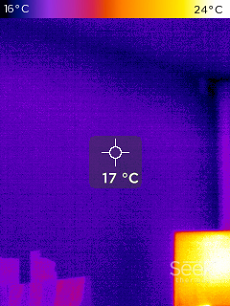
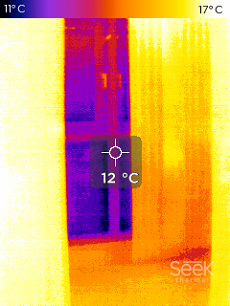 Figure 4: External Surfaces from the Inside 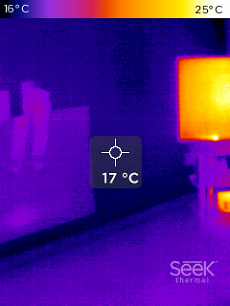
|
|---|
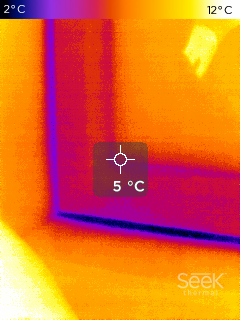
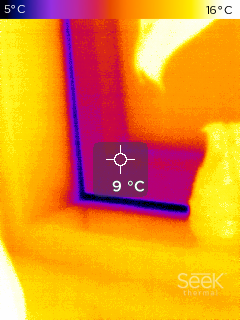 Figure 5: Thermal Bridging and Air Gaps 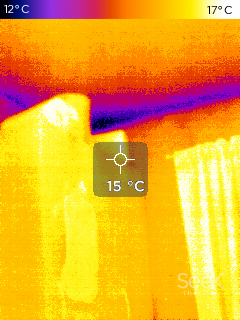
|
|---|
The windows in the properties were investigated further as areas for potential thermal issues. From the left two images in Figure 5 it is clear that thermal bridges exist - or air is infiltrating - around the window. This is an indication of poor installation where the window is not correctly fitted into the surrounding insulation or that the window does not form a tight seal. Again, the temperature of the window is in a range where condensation is possible. Thermal bridging exists in the corner of the kitchen too indicated by the dark blue areas in the right hand image. The room temperature was 20.0°C indicating a temperature drop of 8°C towards the corners of this room.
One specific issue that was identified by residents and the co-op was in the first floor flats - the floors of which are above an unheated and uninsulated bin/storage area. To investigate whether this was an issue, the envelope of a first floor flat was investigated.
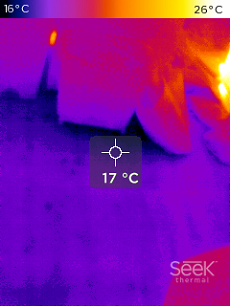
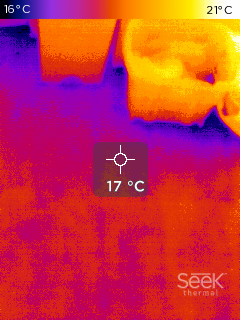 Figure 6: First Floor Flat 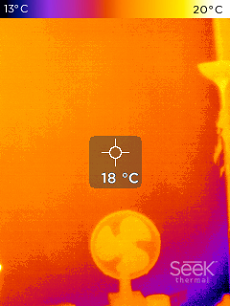
|
|---|
Although the floor temperatures in this flat appear uniform and similar to those in the 8th floor flat (Figure 4), the dry bulb temperature was 1.5°C higher in this dwelling, suggesting that general heat loss through the walls and floor is higher. This is further confirmed by the images in Figure 7 which show the corners in this property. Towards the edges of the rooms, there are cold zones indicating thermal bridging. The drop in air temperature at these corners is in the region of 11-12°C.
It is believed that the concrete structure of the tower is behind these points. The corner thermal bridging and overall higher heat loss through the floor is due to the lack of insulation between the two floors and around this structural concrete. The right hand image of Figure 7 is from inside the uninsulated and unheated binstore below, which had a temperature of 1-3°C. The co-op are intending to commission the fitting of insulation in these areas and the study indicates that an issue does exist in this area.
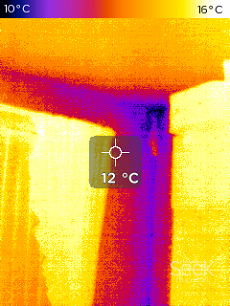
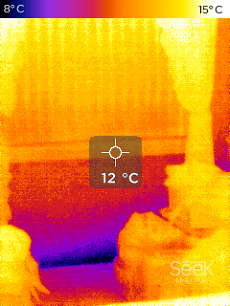 Figure 7: Bottom Flat Thermal Bridges and Bin Area 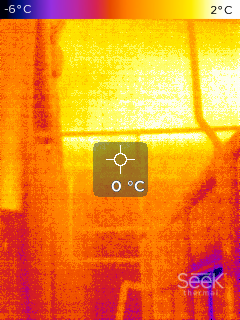
|
|---|
More detail about the thermal investigation and specific information about each flat investigated can be found in the thermal imaging report, which is can be downloaded using the link below.
THERMAL IMAGING REPORT DOWNLOADPerformance of Buildings and Upgrades
The thermo-graphic study provides a partial view of the thermal performance of the tower blocks. It allows any obvious issues from the fabric to be identified but does not provide specific information such as U-values. In this section calculations are presented using the results of the thermographic study.
The windows are an area in which condensation may form. The following steps were carried out to calculate the dew point temperature:
- The saturation pressure was found for the room's dry bulb temperature;
- The partial pressure of the water vapour was determined by multiplying the saturation pressure by the relative humidity;
- Using this, the dew-point temperature was taken to be the saturation temperature of corresponding to the vapours partial pressure.
The average dew point temperature across all the rooms in the properties visited was 7.9 +/- 2°C. In Figure 5, the dew point temperatures are 7.2°C and 8.7°C for the windows (left and centre, respectively). Although the reading is of the frame, the estimated window temperatures are 8°C and 11°C. It is likely that condensation is beginning to form in the left image (from a bedroom). However, the kitchen window is likely to be above the dew point temperature.
The U-values of the window glazing and externally clad walls were also estimated using results from the thermal study. It was assumed that the heat loss from the rooms occur via natural convection to the walls and then 1-D conduction through the wall. Radiation wasn't considered at the internal wall and since there was a temperature outer surface of the building envelope, the U-values could be found without considering heat transfer from this surface.
The heat transfer through the whole construction was determined using:
- The indoor dry bulb and wall/window internal surface temperatures;
- A correlation for natural convection over a vertical plate with a characteristic length of 2m or 1m for the wall and window, respectively;
- The wall U-value was then found using this value of heat transfer alongside the temperatures on either side of the wall.
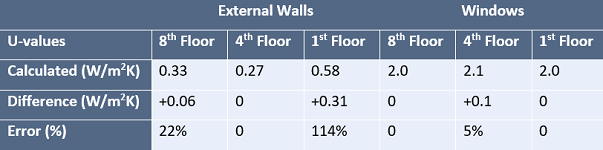
The results are given in Table 1 with comparisons to the U-value reported in the introduction to this section.
Table 1: Calculated U-values Compared with Reported Values
Key Findings
Overall, it is clear that the upgrades installed in the high-rise towers have had the desired result of improving the thermal performance of the flats. There are minimal areas with evident heat loss issues and those that are noticeable, such as thermal bridging around the windows, are somewhat expected and unavoidable. One area which could be upgraded is with the lack of insulation between the bin/storage areas on the ground floor and the first-floor flats. This would reduce the overall heat losses and the large amount of thermal bridging at the corners of these flats.
Another area that could be investigated further is the ventilation. Some of the external images appeared to show open windows (where the whole window was very hot). This suggested that the properties may be under-ventilated and that residents are opening windows to improve the ventilation rate and indoor air quality in the properties. This indication was supported by the fact that only the bathrooms in the flats are mechanically ventilated, the other rooms all being naturally ventilated. The ventilation of the properties could be improved and heat recovery could be integrated to reduce unnecessary heat losses further.