Project Overview
Construction
Occupancy
Behavioural models
Demand
Renewable technologies
Conclusion
Team
Acknowledgements
Behaviour models
It seems logical that in a Holiday Community not everybody will behave in the same way and people will not do the same activities at exactly the same time. Moreover, depending on the lifestyle of the people, they will tend to stay a bit more or a bit less outdoors in comparison with the others. Because of that, we thought to create different behavioural models in order to cover the different behaviours of the people when they are in the Holiday Community. This will have an influence in the demand profile (electricity, hot water and space heating consumption) as the occupants will use more or less energy depending on how much time they are at home.
Furthermore, it was decided to develop 3 different behavioural models regarding the occupants’ behaviour with the aim to create a more relevant 6 houses demand profile by combining them.
The next table shows the schedule of the models:
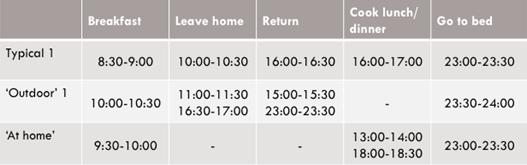
The 'Outdoor' and the 'At home' behaviour assume people will spend more time or no time at home, respectively. For the 'typicl' occupants will spend some hours for outdoor activities.
As you can see, in the Typical model, the occupants leave home in the morning. In the Outdoor model they may go out for a dinner again in the evening and in the At Home model they stay indoor the whole day.
As Craik is located in a forested area with cycling and walking routes, mainly addressed to eco-tourism, it was of great importance to take into account that people would spend time outdoors for leisure activities. As for the typical model, it was created based on a typical load profile for a household on a Sunday when people go out for leisure activities (M.Newborough and F.Augood, 1999) considering holiday behaviour similar to Sunday attitude
The next step was to develop different combinations of these behavioural models and use them to predict, in the next sections, the total energy consumption of the 6 houses of Phase 1. Regarding the allocation of the different models to the households, more emphasis was given to the Typical model as it was thought that it was more representative for this type of holiday communities.
The following figure shows combinations for 6 houses:
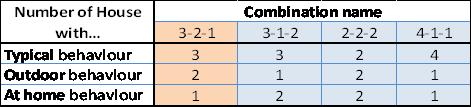
Note that these combinations purely relate to holiday accommodation and with other kinds of communities the combination method could be different.
It is important to highlight that, when one of these behaviour models is used more than once in a combination, it was shifted 30 min forward, e.g. 3-2-1 combination uses the standard typical behaviour, the typical behaviour shifted 30 min and the typical behaviour shifted 60 min.
Thus, by using the different behaviours and shifting them if used more than once, we will obtain a more realistic and uniform energy demand profile. Note that if we use just one behavioural model and we just multiply its consumption times the number of houses that we are dealing with, we are assuming that of the houses will use all the facilities at exactly the same time throughout the whole year, which is very unlikely.
Moreover, it should be mentioned that for the next sections, 3-2-1 Combination was assumed to be the most representative one and its profile demand will be used as the base case when trying to match demand and supply.