
| Previous | Home | Next |
Contents
Scenario 2
Introducing congestion charging to Glasgow City.
Based on past congestion charge results from London and various EU projects, outlind earlier in this web site and the results in which we obtained from both our experiments and our zone research, the following future predictions have been forecasted for Glasgow assuming the city adopts the previously outlined congestion charge scheme.
1 Year
An initial 15% drop in vehicles after the first 6 months, rising to 22.5% after 1 year of scheme operation.
Emissions
Since we know that around 90% of Nitrogen Dioxide emissions each year in Glasgow City are attributed to road vehicles, we can calculate that a 22.5% reduction in traffic would cause present levels of Nitrogen Dioxide and PM10 particle emission levels to drop by 20.3%. This would allow the hourly average levels for both pollutants to significantly decrease, complying with Government Objectives.
Average Travelling speed
From our experiments, we have calculated that between 5 and 6pm throughout the city centre, the average time dealy, in seconds, for a vehicle travelling a distance of 150m is in fact 204seconds. This equates to 22.7minutes delay per kilometre. Assuming that we achieve a 22.5% decrease in the number of vehicles travelling in this zone and considering the present delay on a journey made between 5 and 6pm throughout the city centre and also considering the rate of road expansion, from the transportation section of this site, as well as taking into account the results from past projects, we calculate that delays can be reduced to 17.03minutes/km. This would result in an increase of average travelling speed during this time increasing to 11km/hr.
Fuel Consumption
Achieving a 22.5% reduction in vehicles would result in around 42,740 less vehicles traveling within the charging zones. From our 'Driver Attitude' questionnaire, we can determine each vehicle travels an average of 3km through the charging zones. This would result in a saving of 3km per vehicle per day, equating to 750km per vehicle per year. This figure represents a saving of 470miles per vehicle per year for 42,750 vehicles. Therefore, over 2million litres would total the yearly fuel saving, assuming a 22.5% reduction in vehicles.
Cost
From the vehicles we have identified eligable for payment and the number of vehicles travelling throughout the charging zones, stated in both zone research and our experiment sections of this wedsite, we have calculated how much revenue will be generated from the congestion charge throughout the first year of operation.
During the first three months of operation, we predict a 7.5% drop in traffic, growing to a 15% decrease during 3 to 6 months and finally rising to 22.5% decrease after 12months. Taking into consideration the Blue Badge Holders exempt from travelling, which could vary between 30% and 70% of the total number of badge holders travelling within the charging zones, the number of residents with car ownership, living within zone 1 and 2, eligable for discount and the fleet vehicles also eligable for discount, along with the remaining vehicles eligable for charging, passing through zone 1 and 2 every day, we estimate that in the first three months, on average, the daily amount made from charges will be just over £500,000. Therefore, in the first 3months the charging scheme will have made over £30million in charges alone.
Assuming a 15% reduction in the total number of vehicles travelling on the roads between 3 and 6 months, the amount of £2 and £3 charges for zone 1 and 2 and also, the £1 charge made from residents, will hence decrease. We have also predicted a 10% decrease to £3,385, received from the daily fleet charge. As a result, the daily amount made from charges during the first 3 to 6months will be just over £460,000. Therefore, over £28million will be generated from charges during this 3month period.
Similarly, assuming a 22.5% reduction in the total number of vehicles between the first 6 to 12 months of operation will again reflect decreases in the total amount generated from charging. As a result the daily amount made from charging will decrease to almost £410,000 each day. This equates to over £49million during this 6month period.
Finally, after 1 full year in operation, the congestion charging scheme will have generated almost £108million in charges alone.
Accident Savings
Yearly road casualty reductions will increase slightly due to the reduction of vehicles in this area. Based on past project results we estimate that after 1 year this figure will increase by an additional 3%. Taking into account the present accident rate is 6,200 accidents per year and the average cost per accident is £73,384, corresponding to figures published by the Scottish Statistics for Transport, 2003, this could result in a £15 million saving in the first year.
Time Savings
As a result of 22.5% less vehicles travelling on the road, the rush hour traffic delays will decrease to 17.03 minutes/km, allowing the average speed to increase slightly to 11km/hr. Based on the time savings from the London scheme, we have estimated that our time savings could equate to £42 million in the first year.
Top5 Years
After the congestion charge has been operating for 5years in Glasgow city, we estimate that a 30% reduction in vehicles travelling within the charging zones could be achieved. Of course, this is assuming that a large percentage of proffits are generated into developing the public transport sector, offering a wider choice of routes, more frequent services and improving passenger safety, therfore offering an attractive, alternative mode of passenger transport.
Using similar methods and assumptions as to those above, we predict the following:
Emissions
Levels of Nitrogen Dioxide and PM10 particle emission levels would drop to 19ppb and 10 micrograms/cubic metre.
Average travelling Speed
Due to the reduction in traffic traffic delays during rush hours would decrease to 13.62minutes per kilometre. This would result in the average speed increasing to 13km/hr.
Fuel Consumption
The biggest increase in fuel savings would be witnessed in the first year as a result of the dramatic decrease in vehicle numbers travelling within the charging area. However, this value will continue to rise to £2.15million litres/year assuming 30% decrease in vehicle numbers after 5 years.
Cost
Using the same method as above, we have estimated the amount of revenue from charges each year. These values are as follows: 1 year = £107 million 2 years = £90 million 3 years = £85 million 4 years = £81 million 5 years = £77 million
These figures are based on the assumption that vehicle numbers do decrease by 30% at the end of the 5 years. This would mean that a total of £440 million would be made from charges alone.
Top15 Years
we have chosen not to forecast results for the 15 year period as congestion charging is still relatively new and we do not have material from past projects to predict accurate results so far into the future.
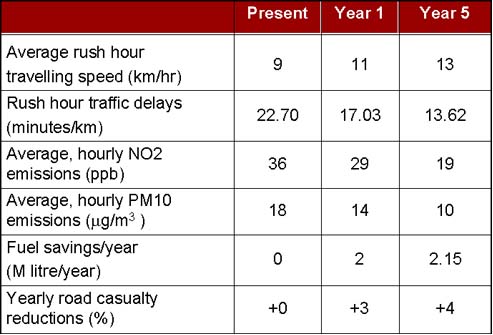
Summary
A table summarising the effects that congestion charging could have in terms of emission levels, average travelling speed, fuel consumption and reduction in the number of road accidents is shown below.
© 2004 All rights reserved. Copyright of Derek Weir, Leanne McMillan, Roy MacLean, Hee Dong Oh & Ayman Elsadig
| Previous | Home | Next |