
| Previous | Home | Next |
Contents
Scenario 3
Introducing ISA to Glasgow
In trying to predict the effects implementing ISA technology to Glasgow may have it was crucial we used a realistic time scale taking into consideration the replacement rate of cars and considering what would be a realistic value for retro fits. It is not possible to assume that after only 1 year 100% of cars would be fitted with the ISA system. Therefore the following time scale has been assumed:
Present: Negotiations commence between public and private sector concerning the new ISA regulation.
Year 1: It becomes law to fit ISA as standard in all new vehicles. Also there is a small demand for retro fits hence ISA is installed in 2% of existing vehicles.
Year 5: ISA market penetration is now 35% partly due to the growing demand for ISA from private individuals.
Year 15: All vehicles are now fitted with an ISA system. ISA becomes mandatory in UK.
All of the following calculations follow this scenario. Hence the following results do not consider what effect future changes to traffic policy by Glasgow Council or Westminster may make.
Number of cars
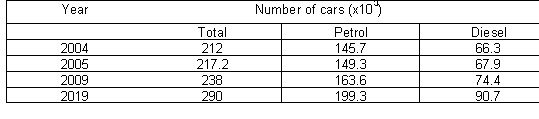
We analysed the trends in car ownership in Scotland using the past 10 years data. From here we were able to predict the number of cars registered in Glasgow (Glasgow currently has 8.7% of the registered cars in Scotland). In addition, these values were divided into petrol (68.73%) and diesel (31.27%) cars.
Present: Estimated number of cars in Scotland = 2,436,600 so the total number of cars in Glasgow is 2,436,600 Of these 145,700 are petrol and 66,300 Diesel
2005: Estimated number of cars in Scotland = 2,496,400 so total number of cars in Glasgow will be 217,200 Of these 149,300 are petrol and 67,900 Diesel
2009: Estimated number of cars in Scotland = 2,735,600 so total number of cars in Glasgow will be 238,000 Of these 163,600 are petrol and 74,400 Diesel
2019: Estimated numbere of cars in Scotland = 3,333,700 so total number of cars in Glasgow will be 290,000 Of these 199,300 are petrol and 90,700 Diesel
Fuel consumption
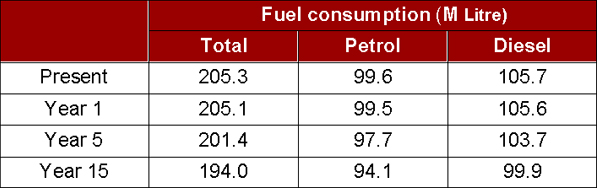
Although amount of fuel consumed by each car has decreased during past 10 years thanks mainly to improved engine efficiency, we have ignored this tendency because we wished to show the affects of ISA out with any other factors. By considering the average fuel saving observed during ISA trials we assumed individual car fuel consumption would decrease by 5.5% when ISA is installed.
Formula = [{(Total petrol consumption / Total number of petrol cars) x (1-fuel decrease rate) x rate of ISA cars} + {rate of non ISA cars x (Total petrol consumption / Total number of petrol cars)}]
It is assumed that the total diesel consumption is the same as 2004.
2004: Petrol: 99,604,900 Litres Diesel: 105,735,300 Litres
2005: Assume 2% of cars are fitted with ISA and each car has a decrease of 5.5% in fuel compared with non-ISA cars. Petrol: [{(99,604,900/149,300) x (1-0.055) x (149,300 x 0.02)}+{(149,300 x 0.98) x (99,604,900/149,300)}] = 99,495,300 Litres = 99.5 million litres Diesel: [{(105,735,300/67,900) x (1-0.055) x (67,900 x 0.02)}+{(67,900 x 0.98) x (99,604,900/67,900)}] = 105,619,000 Litres = 105.6 million litres
2009: Assume 35% of cars are fitted with ISA Petrol: [{(99,604,900/163,600) x (1-0.055) x (163,600 x 0.02)}+{(163,600 x 0.98) x (99,604,900/163,600)}] = 97,687,500 Litres = 97.7 million litres Diesel: [{(105,735,300/74,400) x (1-0.055) x (74,400 x 0.02)}+{(74,400 x 0.98) x (99,604,900/74,400)}] = 103,699,900 Litres = 103.7 million litres
2019: Assume 100% of cars are fitted with ISA Petrol: {99,604,900 x (1-0.055)} = 94,126,600 Litres = 94.1 million litres Diesel: {105,735,300 x (1-0.055)} = 99,919,900 Litres = 99.9 million litres
Number of accidents
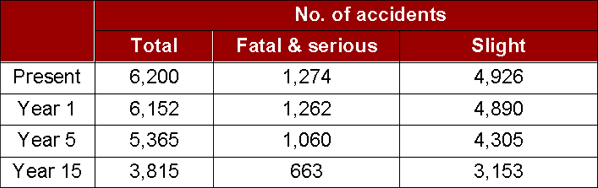
Although the number of accidents has decreased during the past 10 years, we disregarded this trend because we were only interested in the direct effects ISA would make. We assumed fatal & serious injuries would decrease by 48% and slight injuries would decrease by 36% when ISA is installed as per the research findings.
Formula = [{(Number of accidents in 2004) x (1-accident decrease rate) x Rate of ISA cars} + {Rate of non ISA cars x (Number of accidents in 2004)}]
We fixed the number of fatal and serious accidents and the number of slight accidents as per the 2004 predictions.
2004: Fatal & serious accidents: 1,274 Slight accidents: 4,926
2005: Assume 2% of cars are fitted with ISA and each car reduces 48% of fatal & serious accidents and reduces 36% of slight accidents compared with a non-ISA car Fatal & serious accidents: 1,262 Slight accidents: 4,890
2009: Assume 35% of cars are fitted with ISA Fatal & serious accidents: 1,262 Slight accidents: 4,305
2019: Assume 100% of ISA cars are fitted with ISA Fatal & serious accidents: 663 Slight accidents: 3,153
Level of pollutants
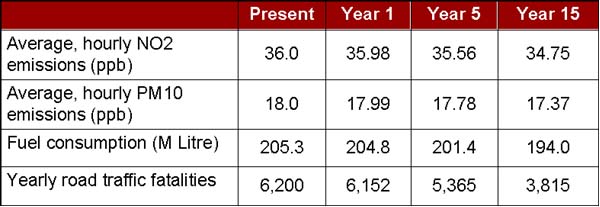
According to the Swedish ISA trial, in cars fitted with ISA there was a slight reduction in the level of exhaust pollutants. CO emissions decreased by 11%, NOX emissions decreased by 7.7%, HC emissions decreased by 8%, PM emissions decreased by 8% and CO2 emissions decreased by 1%. We focused on the average hourly NO2 emissions (ppb) and the average hourly PM10 emissions (micro grams per cubic metre).
Formula = Average hourly NO2 emissions; {(Average hourly NO2 emissions in 2004) x (1-rate of emission occurred by vehicles)} + [{(Average hourly NO2 emissions in 2004) x (Rate of emission occurred by vehicles) x (1- NO2 emissions decrease rate) ´Rate of ISA cars} + {Rate of non ISA cars x (Average hourly NO2 emissions in 2004) x (Rate of emission occurred by vehicles)}]
Average hourly PM10 emissions; {(Average hourly PM10 emissions in 2004) x (1-rate of PM10 emission occurred by vehicles)} + [{(Average hourly PM10 emissions in 2004) x (Rate of PM10 emission occurred by vehicles) x (1- PM10 emissions decrease rate) x Rate of ISA cars} + {Rate of non ISA cars x (Average hourly PM10 emissions in 2004) x (Rate of PM10 emission occurred by vehicles)}]
2004: Average hourly NO2 emissions: 36.0 Average hourly PM10 emissions: 18.0
2005: Assume 2% of cars are fitted with ISA and each reduces 7.7% of NO2 emissions and reduces 8% of PM emissions compared with a non-ISA car Average hourly NO2 emissions: 35.98 Average hourly PM10 emissions: 17.99
2009: Assume 35% of cars are fitted with ISA Average hourly NO2 emissions: 35.56 Average hourly PM10 emissions: 17.78
2019: Assume 100% of cars are fitted with ISA Average hourly NO2 emissions: 34.75 Average hourly PM10 emissions: 17.37
SYSTEM COST AND BENEFIT
The table below shows the cost per accident by type of casualties in Scotland, (2001 £), Scottish Statistics for Transport, 2003
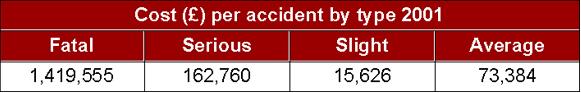
Present Number of accidents (2004): 6,200 Cost by accidents (2004): £ 454,980,900
Year 15 Number of accidents (2019): 3,815 Cost by accidents (2019): £ 279,959,960 Cost reduction: £175,020,940
Fuel saving
Present Fuel consumption (2004): 99.6 million litres (Petrol), 105.7 million litres (Diesel) Fuel cost (2004): £ 76,696,000 (Petrol), £ 81,416,200 (Diesel)
Year 15 Fuel consumption (2019): 94.1 million litres (Petrol), 99.9 million litres (Diesel)
Fuel cost (2019): £ 72,477,000 (Petrol), £76,938,000 (Diesel) Fuel cost saving: Petrol: £ 4,219,000 Diesel: £ 4,478,200 Total: £ 8,697,200
Benefit of reducing accidents and fuel consumption
Cost benefit = Reduction cost of accident + fuel cost saving = £ 183,605,940
Relationship between system cost and benefit
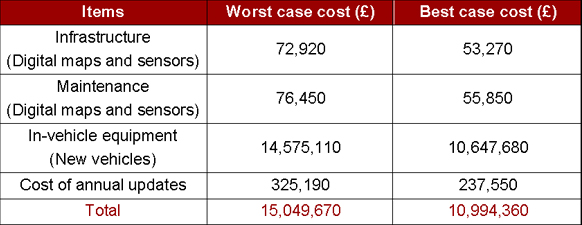
Based on the University of Leeds research, this section has adopted the same relationship between system cost and benefit. We assumed that the car manufacturers would be fit the mandatory dynamic system in their new vehicle. As we have already calculated the cost/benefit we will now show the cost for establishing ISA in Glasgow.
Some of our past research from Leeds University and Swedish trials can be found here.
Worst case (with low GDP growth): £ 183,605,940 /12.2 = £15,049,670 Best case (with high GDP growth): £ 183,605,940 /16.7 = £10,994,360
If there is an accident when the company has low GDP growth, the social cost is much lower than a high GDP growth. Therefore, if there is some accident, absolute cost by accident is much higher. We have obtained costs for high and low GDP as shown below:
© 2004 All rights reserved. Copyright of Derek Weir, Leanne McMillan, Roy MacLean, Hee Dong Oh & Ayman Elsadig
| Previous | Home | Next |