
| Previous | Home | Next |
Contents
Scenario 1
No change in current trends
This scenario assumes that the current transport trends, 1992 - 2002, in Scotland are allowed to continue for the foreseeable future unchallenged. Based on this we will predict the impacts this approach will have on our criteria. First of all though what are the current transport trends in Scotland?
Current trends
From our research we have identified the current trends, in relation to our four criteria, to be that:
Future predictions
Vehicle average travelling speed
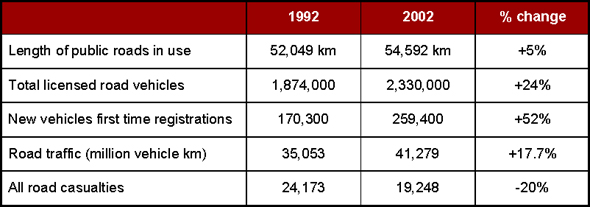
As shown in the period 1992 2002 the length of public roads in use in Scotland increased by 5%. But in the same period the volume of vehicles increased by 24% and road traffic by 17%. From this it is quite clear that the development of the road networt, is not in parallel with the increase in the volume of traffic, and as a result there isnt enough capacity in the road network to accommodate the traffic. This means that there is less road per vehicle so travelling speeds will decrease.
Fuel consumption
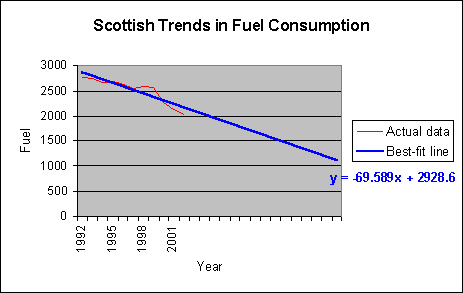
During the period 1992 2002 the fuel consumption in Scotland has fallen by %. We have attributed this trend to a number of factors, mainly:
The graph and table shown below highlight the current trend and indicate what will happen in future years.
Number of road casualties
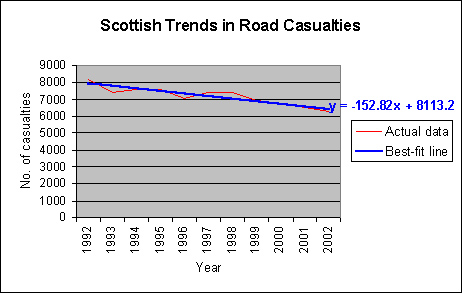
During the period 1992 2002 the number of road casualties in Scotland fell by 20%. We have attributed this to:
The graph and table shown below highlight the current trend and indicate what will happen in future years.
Level of pollutants
Although the current trend is decreasing, much of this can be attributed to the decline of heavy (polluting) industry in Scotland particularly in densely populated areas such as Glasgow and the surrounding Strathclyde area. As a result of the this the dominating contributor to pollution (NO2 and PM10) levels has changed from heavy industries to vehicle exhaust fumes, in some cases up to 90%. It is for this reason that we predict an increase of pollution levels if nothing is done to tackle the current problems.
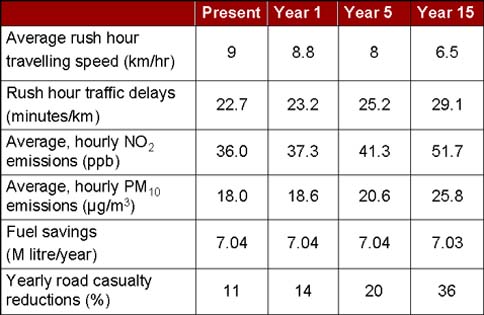
Summary of Scenario 1 - No change in current trends
The table below summarises Scenario 1 highlighting the impacts on each criteria.
© 2004 All rights reserved. Copyright of Derek Weir, Leanne McMillan, Roy MacLean, Hee Dong Oh & Ayman Elsadig
| Previous | Home | Next |