Land Availability
GIS Software
Background
Land identification was a core aspect of the project, with the significance of the contribution of clean urban energy hinging directly on land availability. For this purpose, a piece of Geographic Information Software (GIS) was used. GIS is useful for collecting large amounts of data sets that can be layered over one another.
For our purpose, we were primarily interested in vacant and derelict land, and how this could be exploited. To assist with this, GOMAP was developed by Energy Systems Research Unit (ESRU) at the University of Strathclyde, in collaboration with the Glasgow city development department. A download for this software can be found here.
The idea is that although the data used for this project is for Glasgow, this process could be repeated in any city around the world.
GOMAP Features and Scoring
GOMAP splits the city in to a grid of 20m x 20m blocks, with each block given a score based on the likelihood of obtaining planning permission within it. Figure 1 shows the map of Glasgow as seen in GOMAP.
GOMAP then layers applied policies and technical features across the city. Each policy and technical constraint is given a score between 1 and 4. Policies are scored as possible, intermediate, or sensitive. Technical constraints are scored as favourable, likely, or unlikely. A score of 4 denotes areas that are not available for development, these are called Showstoppers. The scoring system can be seen in Figure 1, displaying policy score followed by the score of technical aspects. The score of a given block is then the average score of all policies and technical constraints in action; the lower the score, the more likely it is to obtain planning permission.
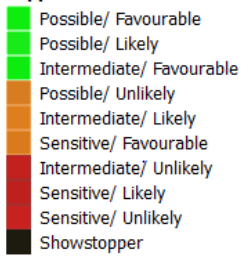
Blocks with an overall score of 1 are highlighted green, and are areas that are most likely to obtain planning permission. Thus these are the areas that we targeted in our initial land search. See Land Searches.
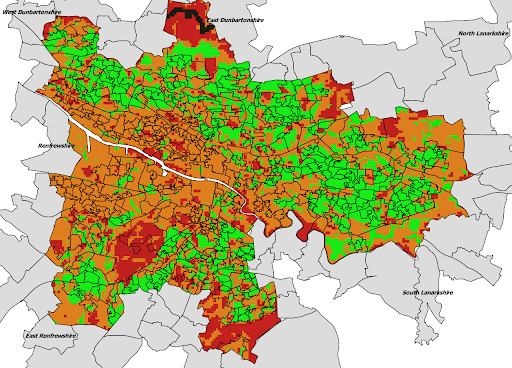
Areas highlighted orange have an overall score of 2, particularly with policy scores ranging from possible to intermediate. These areas are covered in Policy.
Land Searches
Several specific search scenarios were considered in the project to evaluate their potential contribution. The initial focus of the project was to assess the availability of vacant and derelict land in the city, as these areas currently serve little to no purpose, and would be easier to obtain planning permission for than currently developed land. Using the GIS software, a ‘scope’ was applied to identify all vacant and derelict land, and the volume of land area for each score was noted. In particular, the area of land highlighted green, and so scored at a 1 was of most interest, as this land would be most readily available to be used for development at present, at around 0.8 km2. These totals can be seen in Table 1.
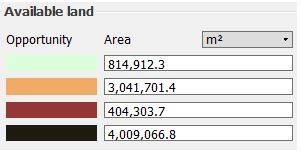
On further inspection of these findings, it could be seen that a significant volume of land was highlighted orange, and so scored at a 2. This initiated an investigation into the policies and technical constraints active in these orange areas - See Policy.
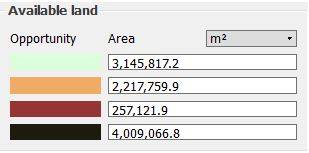
The total area of available land after policy change can be seen in Table 2.
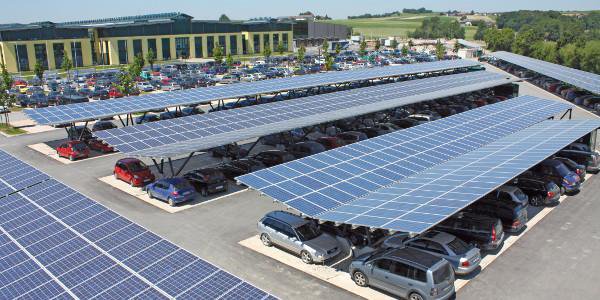
Finally, additional land areas were investigated outside of vacant and derelict land. Following this, a search was carried out for car parks in the city, with a view to deploying PV canopies over these areas. Wind energy for these areas was neglected as the of deployment wind turbines at these sites was discouraged for both safety reasons and impact on residential amenities such as noise and “flickering effect”. The search for car parks was carried out using Google Earth, where the approximate size of the car parks was calculated with the measurement tool. Only substantially-sized car parks were considered, with areas over 1000m2, as it was deemed irrational to deploy canopies on very small car parks with insignificant energy yield. The total area of substantially-sized car parks is 1.3 km2. The total land search areas can be seen in Table 3.
| Land Area | |
|---|---|
| Vacant and derelict land | 0.8 km2 |
| Land after the policy changes | 3.3 km2 |
| Cark Parks | 1.3 km2 |
Areas from each search scenario were entered into the decision support tool to estimate their respective contribution towards each demand scenario. Go to contribution.
Policy
Planning policies are created to both encourage and inhibit development as appropriate. For this project we wanted to explore which policies were inhibiting the development of vacant and derelict land, and how targeted policy relaxation could increase the area of easily developed land throughout the city as determined by GIS.
The following table shows all the policies applied within Glasgow, and the headings they are categorised under within GIS. To narrow down these policies, we looked at policies that both covered a significant enough area that their relaxation would create a significant increase in the amount of land available for development, and also that there was scope within the policy for it to be relaxed in the first place.
All the policies
| Biodiversity | Developmental | Environemtal | Social | Visual Intrusion |
|---|---|---|---|---|
|
|
|
Policies Selected
As a result, these are the 5 policies that met both of those constraints:- Strategic Development Framework
- Local Development Framework
- Economic Policy Areas
- Green Network Opportunity
- Visual Impact
Strategic Development Framework:
It is a requirement for the four largest cities in Scotland (Aberdeen, Dundee, Edinburgh, Glasgow) to have in place a strategic development plan. In the case of Glasgow this is called the Clydeplan, and is used to prepare and maintain an up to date strategic development plan for the Glasgow city region. You can download the Clydeplan here.
Local Development Framework:
Local Development Plans are required for each council area across Scotland. These set out policies that guide decisions on planning applications as well as identifying areas of change and allocating sites for new development. More information regarding this is contained within the Clydeplan, linked above.
Economic Policy Areas:
The Glasgow and the Clyde Valley Green Network is a large-scale long-term transformational programme of action covering the city region. It seeks to address the need for green infrastructure across the city region by linking urban and rural communities, and by promoting healthier lifestyles, better environments, greater biodiversity, stronger communities and economic opportunity through a programme of positive environmental action. More information on this can be found at https://www.gcvgreennetwork.gov.uk/.
Green Network Opportunity:
Economic policy areas are areas that have been identified as requiring monetary injection to transform the area. As Glasgow's economy has changed significantly with the reduction in manufacturing, large areas of land have been left empty, and present a good opportunity to develop and re-vitalise the area with a diversified economic output. More information regarding this can be found in the Clydeplan, linked above.
Visual Impact:
Visual impact is relevant whenever a piece of land that is to be developed is within a certain radius of housing.
Policy Relaxation
Relaxation of these policies would not mean changing the content within them, but rather how they are applied. By reducing the influence of each of the selected policies, the area of easily developed vacant and derelict land can be increased dramatically, opening up areas that were previously constrained. The first four policies are generic development policies that are applied throughout the city of Glasgow. Each of these policies is designed to encourage development according to their individual mandate, and each is to make use of current vacant and derelict land as a primary resource. 60% of Glasgow residents live within 500m of vacant and derelict land (Glasgow.gov.uk, 2019), meaning the development of this land would benefit a large portion of the population. Visual impact is in place to restrict developments within a radius of housing, however is found to be particularly constraining. The relaxation of how visual impact is applied has the potential to be particularly contentious, however by finding a mutual benefit for residents and developers a solution that satisfies both parties can be realised for example cheaper charging for those directly affected by developments. Crucially, renewable energy developments can be considered as temporary, and therefore at the end of their lifespan or even before the land can be used for alternate developments of so desired.
Table 5 below shows the policies selected for relaxation, the area they each occupy within the area ranked orange in the GIS, and the increase in the area ranked green as a result of their individual relaxation. The results from individual relaxation were varied, with some policies making a much more significant impact than others. However, due to the large amount of overlap between these five policies, the overall increase in green areas was much greater, rising from approximately 0.8 km^2 before any changes, to 3.3 km^2 afterwards. This represents over a 400% increase on the pre-existing area of easily developed land, and the significance of this can be found on the contribution page.
| Policy Feature | Coverage within orange areas (km2) | Increase in green areas due to relaxation (km2) |
|---|---|---|
| Strategic Development Framework | 2 | 0.46 |
| Local Development Framework | 0.48 | 0.023 |
| Economic Policy Areas | 0.98 | 0.38 |
| Green Network Opportunity | 0.41 | 0.069 |
| Visual Impact | 1.4 | 0.44 |
References
- Anon., n.d Kenya Energy Future [Online]
Available at: https://kenyaenergyfuture.wordpress.com/2015/09/10/africas-largest-solar-carport-in-kenya/ - Gomap software [Online]
Available at: https://www.strath.ac.uk/research/energysystemsresearchunit/applications/gomap/ - Clydeplan-sdpa.gov.uk. (2019). Home. [online]
Available at: https://www.clydeplan-sdpa.gov.uk/images/ApprovedPlanHighRes.pdf?fbclid=IwAR2SueXylWBZOSYwoMNQ5t080Tz77byjGcnJcbj7sCOhzkk51bzh-qVdWbw - Gcvgreennetwork.gov.uk. (2019). Home - GCV Green Network. [online]
Available at: https://www.gcvgreennetwork.gov.uk/ [Accessed 7 May 2019]. - Glasgow.gov.uk. (2019). City Development Plan - Glasgow City Council. [online]
Available at: https://www.glasgow.gov.uk/index.aspx?articleid=16186 [Accessed 7 May 2019].