Contribution
Results
In Table 1 below, only solar contribtuion is displayed; wind contribution results concluded that it was overall a less suitable option for Glasgow, and therefore discounted from our results.
As the use of wind turbines in car parks was discouraged for both safety reasons and the impact on residential amenity, wind energy is only shown for land areas where it is suitable for deployment. Scenario 2024 has the target of 10% electrification of cars. As the electricity demand of this scenario is low, even using only land that is highly likely to gain planning permission, solar energy is capable of meeting this scenario.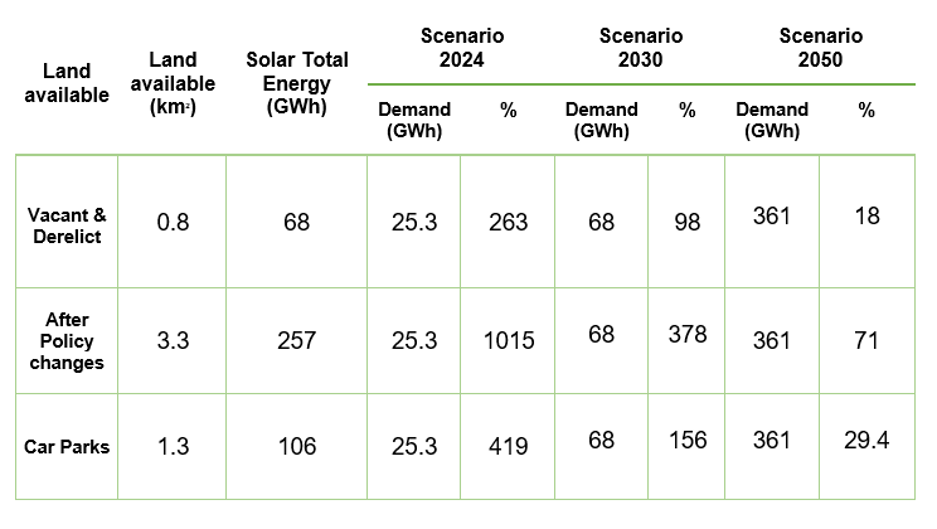
Scenario 2024
Total Cars
0.8 km2
Solar Contribution
Wind Contribution
2) Land Availability
3.3 km2
Wind Contribution
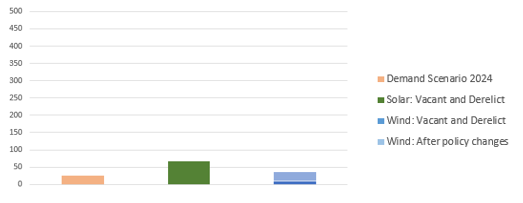
Scenario 2030
For the Scenario 2030, with 50% electrification of buses plus 10% electrification of cars, the total electricity demand more than doubles. However, solar power on all likely vacant and derelict land can still meet all EV demand.
Land Availability
0.8 km2
Solar Contribution
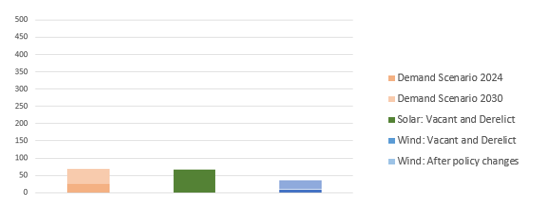
Scenario 2050
Finally, in Scenario 2050 detailing the future target of 100% transport electrification, vacant and derelict land is not enough. Only policy changes will help unlock enough land to make a significant contribution to the demand. Combined with car parks, the whole demand can be met by solar PV. However, this would require drastic changes to the city landscape.
Total Cars
1) Land Availability
3.3 km2
Solar Contribution
2) Land Availability
+ Car Parks:
4.6 km2
Solar Contribution
Required Charge Points
The facilitation of a large increase in EVs can only be realised through a vast expansion of the charge point infrastructure network. There are currently 80 public charge points in Glasgow, largely concentrated in the centre and west of the city (Zap-Map, 2019). According to an EU commissioned study, it is recommended that there is at least 1 charge point for every 10 EVs (Transportenvironment.org, 2019). By using this information an estimate of the charge point requirements for Glasgow can be obtained.
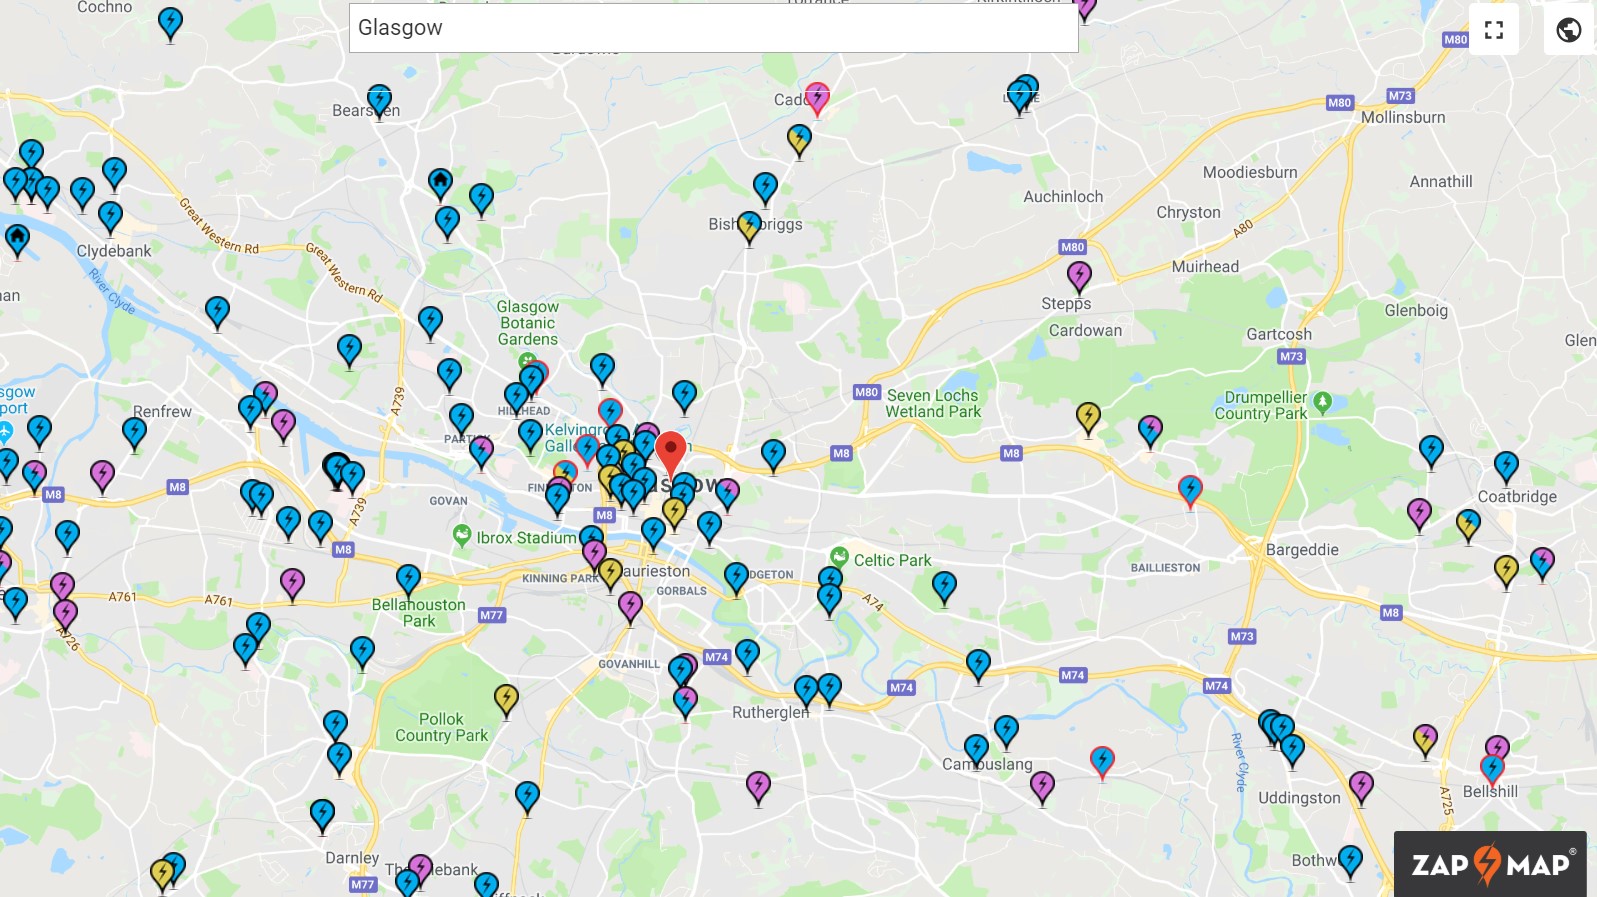
Following the analysis of car parks for land area, it was estimated that there were approximately 56,000 car parking spaces within this area, not including on street parking, with each parking space taking up an area of 23 m2 including space for manoeuvring in and out of each space. Existing car parking spaces represent the most obvious short-term solution to avoiding charge point poverty as they are well spread throughout the city and minimal changes would have to made. This, in addition to a small development of charge points co-located with clean energy generation would ensure a strong EV charging network that could benefit everyone.
For this purpose we only considered Scenario 2024 and Scenario 2050 for charge point roll out as it is assumed that all electric buses will be charged privately at bus depots.
Scenario 2024
Scenario 2024 envisages that there will be 25,000 EVs, equivalent to 10% of the current private car fleet. To ensure that each car may be charged regularly, this will require at least 2,500 charge points, following EU directive. This equates to converting approximately 4.5% of current car park spaces in to EV charge points. Alternatively, 2,500 charge points would cover an area of approximately 58,000 m2, or 7.2% of the existing easily developed areas for vacant and derelict land.
Scenario 2050
Scenario 2050 evaluates the potential of the complete electrification of transport throughout Glasgow. This equates to roughly 218,000 electric cars that will require access to charge points in the future. This means that at least 21,800 charge-points will be required throughout Glasgow to meet this demand. 21,800 charge points is nearly 50% of all current off road parking spaces, or 15.4% of the 3.3 km2 green ranked areas of vacant and derelict land following policy relaxation.
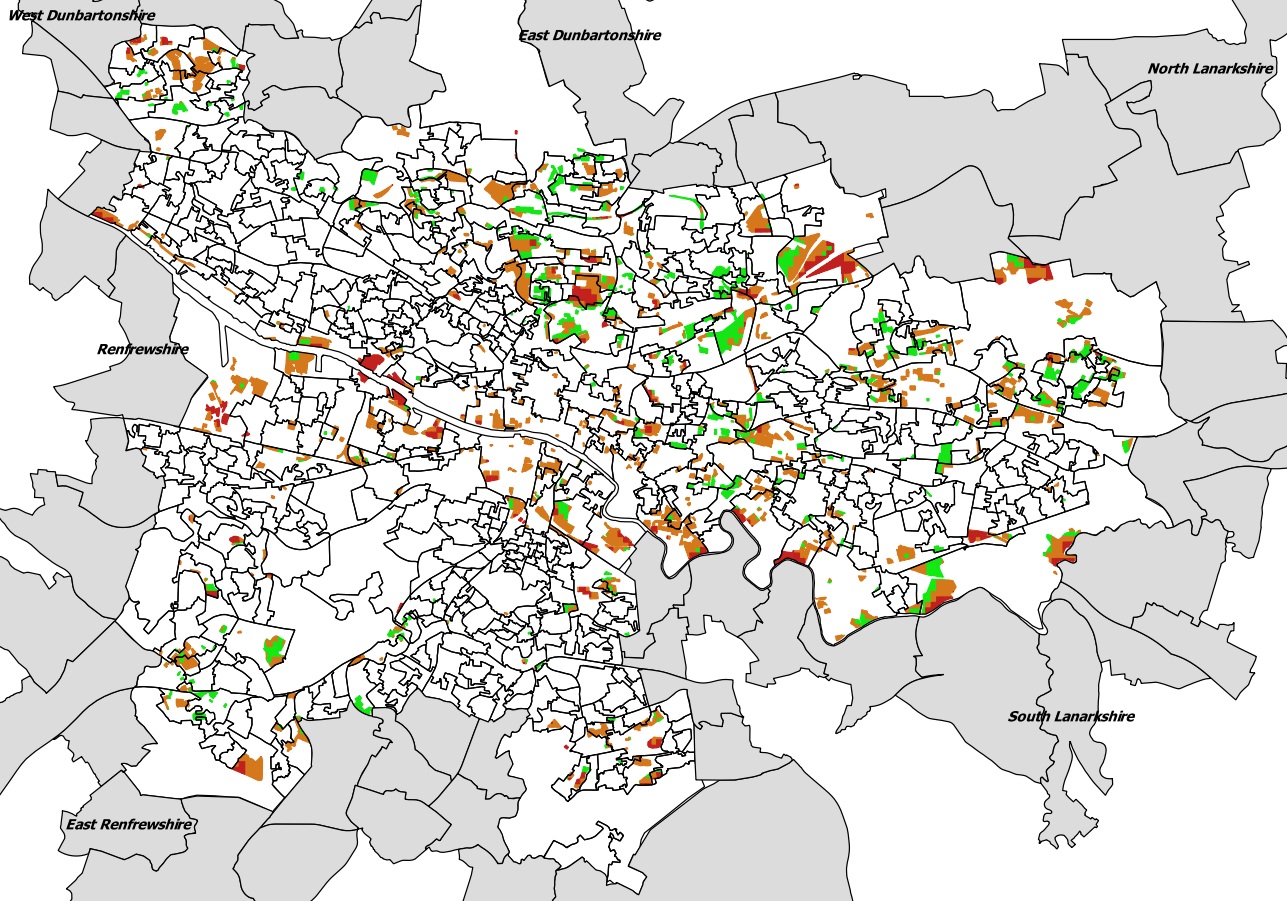
Distribution
The distribution of these charge points is equally as important as their installation. Shown in gomap figure below, the areas of green, indicating easily developed land, align with areas of increased social housing and tower blocks in the east end of Glasgow. By developing these areas with clean energy generation and co-locating charge points, this would provide access to members of the population that would have an increased reliance on a public charge point network due to limited private availability.
This is only a brief analysis of charge point requirements within Glasgow. To ensure charge point poverty is avoided, a much more comprehensive analysis would be required, developing areas with higher demand as a priority to provide a seamless transition to EVs from traditional combustion engines. A lack of access to charge points is one of the primary reasons for people not wanting to buy an electric car, and so by making charge points more accessible, EVs in turn become much more feasible as a method of transport.
References
- Anon., n.d gertimga. [Online]
Available at: http://gertimga.pw/solar-panels-Reduce-Carbon-Footprint-t-Solar-Solar.html - (Zap-Map), A. (2019). Map of charging points for electric car drivers in UK: Zap-Map. [online] Zap-Map.
Available at: https://www.zap-map.com/live/ [Accessed 7 May 2019]. - Transportenvironment.org. (2019). [online]
Available at: https://www.transportenvironment.org/sites/te/files/Charging%20Infrastructure%20Report_September%202018_FINAL.pdf [Accessed 6 May 2019].