Demand
The assessment of demand was achieved through the decision support tool discussed in the deliverables tab. This assessment is based upon the definition of scenarios, as well as the models of electric cars and buses used to compose these scenarios.
Crucially, within the DST you are able to update the electric vehicles models, in addition to changing and/or adding new scenarios. This allows any user to generate their own scenarios and predictions of energy demand based upon their own parameters. However, in order to guide our enquiries, the city of Glasgow was used as an example for this project. Consequently, the three scenarios utilised are also based upon governmental targets applicable to Glasgow.
Electricity demand calculation
As previously mentioned, the electrcity demand calculation is scenario-based, but is also dependant on the models of electric vehicles used within each scenario. Therefore, in the DST when defining the scenarios, the user needs to choose the models and quantity of electric cars and buses that will be used to calculate the demand.
The DST includes a database for both the electric cars and buses, where the user will be able to update the models. The demand for each of scenario is therefore calculated by taking the annual consumption of the EV models for the scenario and multiplying it by the number of EVs composing the scenario.
It should be highlighted that this annual consumption is calculated based on empirical data from real-life consumption, as opposed to manufacturers data that is often over estimated. As well as this assumptions were made such as average trip duration and average driving speed. The calculations made did not include charging profiles for vehicles given that it is very difficult to predict future charging patterns with the presence of a large number of EVs.
In addition, and as previously explained, the project is a purely quantitative analysis of the potential contribution of urban renewable energy resources. As a consequence, the instantaneous demand is not required for this project, just the overall annual electricity demand of EVs.
The DST calculates separately the energy demand for the different models of EV. The method developed is as follows:
Private cars demand
To calculate the electricity demand of cars, substantial background research was required, and assumptions drawn from literature. These assumptions are presented in Table 1:
| Assumptions | Source | |
|---|---|---|
| Cold weather | 212 days | Choice for Glasgow |
| Mild weather | 153 days | Choice for Glasgow |
| Trip duration per day (average) in Glasgow | 20 min | Average calculated from (Transport Scotland, 2018) |
| Average driving speed in Glasgow in 2006 | 36.2 km/h | (Scottish Household Surveys, 2006) |
| Charging losses | 20 % | (Hayes, et al., 2011) |
In addition, the real range consumption was obtained thanks to an online database (EV Database, s.f.), where all the manufacturer’s and real world consumption data is gathered. Note that in this database two consumptions are provided for cold and mild weather conditions. This is because the use of heating and outdoor temperature significantly affects the consumption per kilometre of cars.
Once this information and assumptions were gathered, the annual electricity demand (AEDcars) of each car can be calculated:
Where:
Applying the method to the gathered information for currently available electric car models, Table 2 shows some of the resulting annual consumptions obtained through the DST:
| EV model | Consumption cold weather (kWh/mi) | Consumption mild weather (kWh/mi) | Annual Consumption (kWh) |
|---|---|---|---|
| Average | 0.347 | 0.255 | 1011.6 |
| Audi e-tron 55 quattro | 0.415 | 0.320 | 1232 |
| Hyundai Kona Electric 64 kWh | 0.310 | 0.220 | 894 |
| Jaguar I-Pace | 0.420 | 0.315 | 1235 |
| BMW i3 120 Ah | 0.315 | 0.220 | 904 |
| Nissan Leaf | 0.315 | 0.230 | 917 |
| Volkswagen e-Golf | 0.320 | 0.235 | 934 |
| Hyundai IONIQ Electric | 0.280 | 0.200 | 809 |
| Hyundai Kone Electric 39 kWh | 0.300 | 0.215 | 868 |
Please NOTE:
Cold weather is the 'worst-case' based on -10°C ambient temperature and full use of heating within the vehicle. Mild weather: is the 'best-case' based on 23°C ambient temperature and no use of A/C. The energy use will depend on speed, style of driving, climate and route conditions.
Public bus demand
The bus fleet is split into two different bus types: a smaller bus for travel within the city centre, and a larger bus connecting the city centre with its surrounding areas. For this reason, the DST provides a database with both bus types. In this database information is provided about their consumption, passenger capacity, and charging time.
The data for the consumption per kilometer of different models of currently available bus models was obtained from obtained from (Zero Emissions Urban Bus System, 2016).
The average daily distance each bus travels and the number of working days per year was also considered for calculating the demand. Table 3 shows these assumptions for the city of Glasgow:
| Assumptions | Source | |
|---|---|---|
| Daily distance | 250 km | (Transport and Environment, 2018) |
| Number of days driven per year | 350 km | (Transport and Environment, 2018) |
Note: Charging losses of 20% were applied to buses.
Combining information from the table above with consumption per kilometre, the annual electricity demand of a bus, AEDbus, can be obtained:
Where:
In light of the above, Table 4 shows some of the resulting annual consumptions for buses provided by the DST:
| Electric Bus Model | Consumption (kWh/km) | Passenger capacity | Speed (km/h) | Charging time (h) | Length (m) | Annual Consumption (kWh) |
|---|---|---|---|---|---|---|
| Sileo S10 | 0.85 | 78 | 75 | 2/5 h | 10.7 | 89250 |
| Ebusco 2.1 HV | 0.85 | 90 | 80 | 4.5/3 h | 12.0 | 89250 |
| Evopro Modulo C68e | 0.62 | 55 | 65 | 5 h | 8.0 | 65100 |
| CRRC C12 | 1.00 | 86 | 70 | 2 h | 11.9 | 105000 |
Personal modes of transport
Energy consumption for personal modes of transport is substantially smaller in comparison to demand for cars or buses. Therefore, the energy demand of personal modes of transport was considered only as a small percentage of the total energy consumption of cars. In the case of Glasgow, this type of transport is only regarded in SCENARIO 2050.
Scenario definition for Glasgow
The following are the scenarios employed to calculate the annual demand for EVs, considering varying levels of penetration and based on several Scottish governmental and council targets:
SCENARIO 2024:
Glasgow City Council target for 2024
This scenario is based upon the Glasgow City Council target (Harbinson, 2018) which aims to have 25,000 electric vehicles in the city by 2024. This number of vehicles would represent transforming roughly 10% of the current private car fleet to electric vehicles.
SCENARIO 2030:
Scenario 2024 + Scottish Government 2030
This scenario incorporates Scenario 2024, in addition to the Scottish Government target for 2030 that anticipates that at least 50% of buses in Scotland will be converted to electric by 2030 (Transport Scotland, 2018).
The current number of buses within Glasgow is approximately 970. It was assumed that around 40% of buses are used within the city center, and therefore can be classed as small capacity buses so that they may be easily manoeuvered in narrow streets. The remaining 60% are assumed to be used to take people to the outskirts of the city, therefore driving longer distances and consequently, a higher capacity bus model is more appropiate.
Therefore for Scenario 2030, there will be 486 electric buses along with 25,000 electric cars carried forward from Scenario 2024.
It should be noted that it was assumed that the first buses to be converted to electric will be smaller capacity buses that operate within the city centre. Therefore, from the 486 buses, 388 buses correspond to the small capacity bus model and 97 to the high capacity model chosen.
SCENARIO 2050:
Complete electrification of transport
This is the most futuristic and agressive scenario, in which we predict that all transport throughout the city will be electric. This is based upon another Scottish Government policy that prohibits the sale of combustion engine cars past 2032 (EURODRIVE, 2018).
For this scenario 100% of private cars and public buses would be electric, although it was predicted that the number of private cars in the city will slightly decrease with respect to the current fleet. This is due to the assumption that the public transport network will be improved on its current standard, and also due to the introduction of personal modes of transport (such as electric bikes, scooters, etc) replacing the need for private cars.
In the case of Glasgow, it was assumed that the demand of these personal modes of transport will account for 10% of the total electric car demand.
Table 5 summarises the number of cars, buses, and personal modes of transport composing the scenarios defined for the city of Glasgow:
| Name of the Scenario | Scenario 2024 | Scenario 2030 | Scenario 2050 |
|---|---|---|---|
| No. Buses (smaller capacity) | 0 | 388 | 388 |
| No. Buses (higher capacity) | 0 | 97 | 583 |
| No. Cars | 25,000 | 25,000 | 217,463 |
| Individual modes of transport | 0% | 0% | 10% |
Finally, the DST will ask the user to define the models of electric car and buses to be used in each scenario. Figure 1 shows the choices made for the scenarios defined for Glasgow:
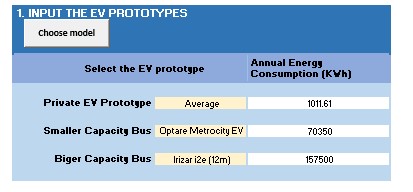
As it can be seen in Figure 1, the average consumption of all the cars included in the database was used as it was considered that many different models will be used in these scenarios. Therefore the average consumption best represents this variety. As already mentioned, two different models were used for the scenarios. The models used for the small and high capacity buses were chosen only considering size and passenger capacity.
References
- EV Database, s.f. Electric Vehicle Database. [Online]
Available at: http://zeeus.eu/uploads/publications/documents/zeeus-ebus-report-internet.pdf - Hayes, J. G., R. de Oliveira, P. R., Vaughan, S. & Egan, M. G., 2011. Simplified Electric Vehicle Power Train Models adn Range Estimation. s.l., s.n.
- Scottish Household Surveys, 2006. Long Distance Commuting in Scotland. Edinburgh, Scottish Executive.
- Transport and Environment, 2018. Marketplace, economic, technology, environmental and policy perspectives for fully electric buses in the EU,s.l.:s.n
- Transport Scotland, 2018. Transport and Travel in Scotland 2017, Edinburgh: s.n
- Zero Emissions Urban Bus System, 2016. An overview of electric buses in Europe, s.l:s.n
- EURODRIVE, 2018 Scotland to ban petrol and diesel car sales by 2032 [Online]
Available at https://www.eurodriveuk.com/scotland-to-ban-petrol-and-diesel-car-sales-by-2032/ - Harbinson, E., 2018. Glasgow 'to have 25,000 electric cars by 2024' as city plans to cut out fuel emissions.GlasgowLive 29 November.
- Transport Scotland, 2018 Electric Nation 2018, Dundee: Urban Foresight.