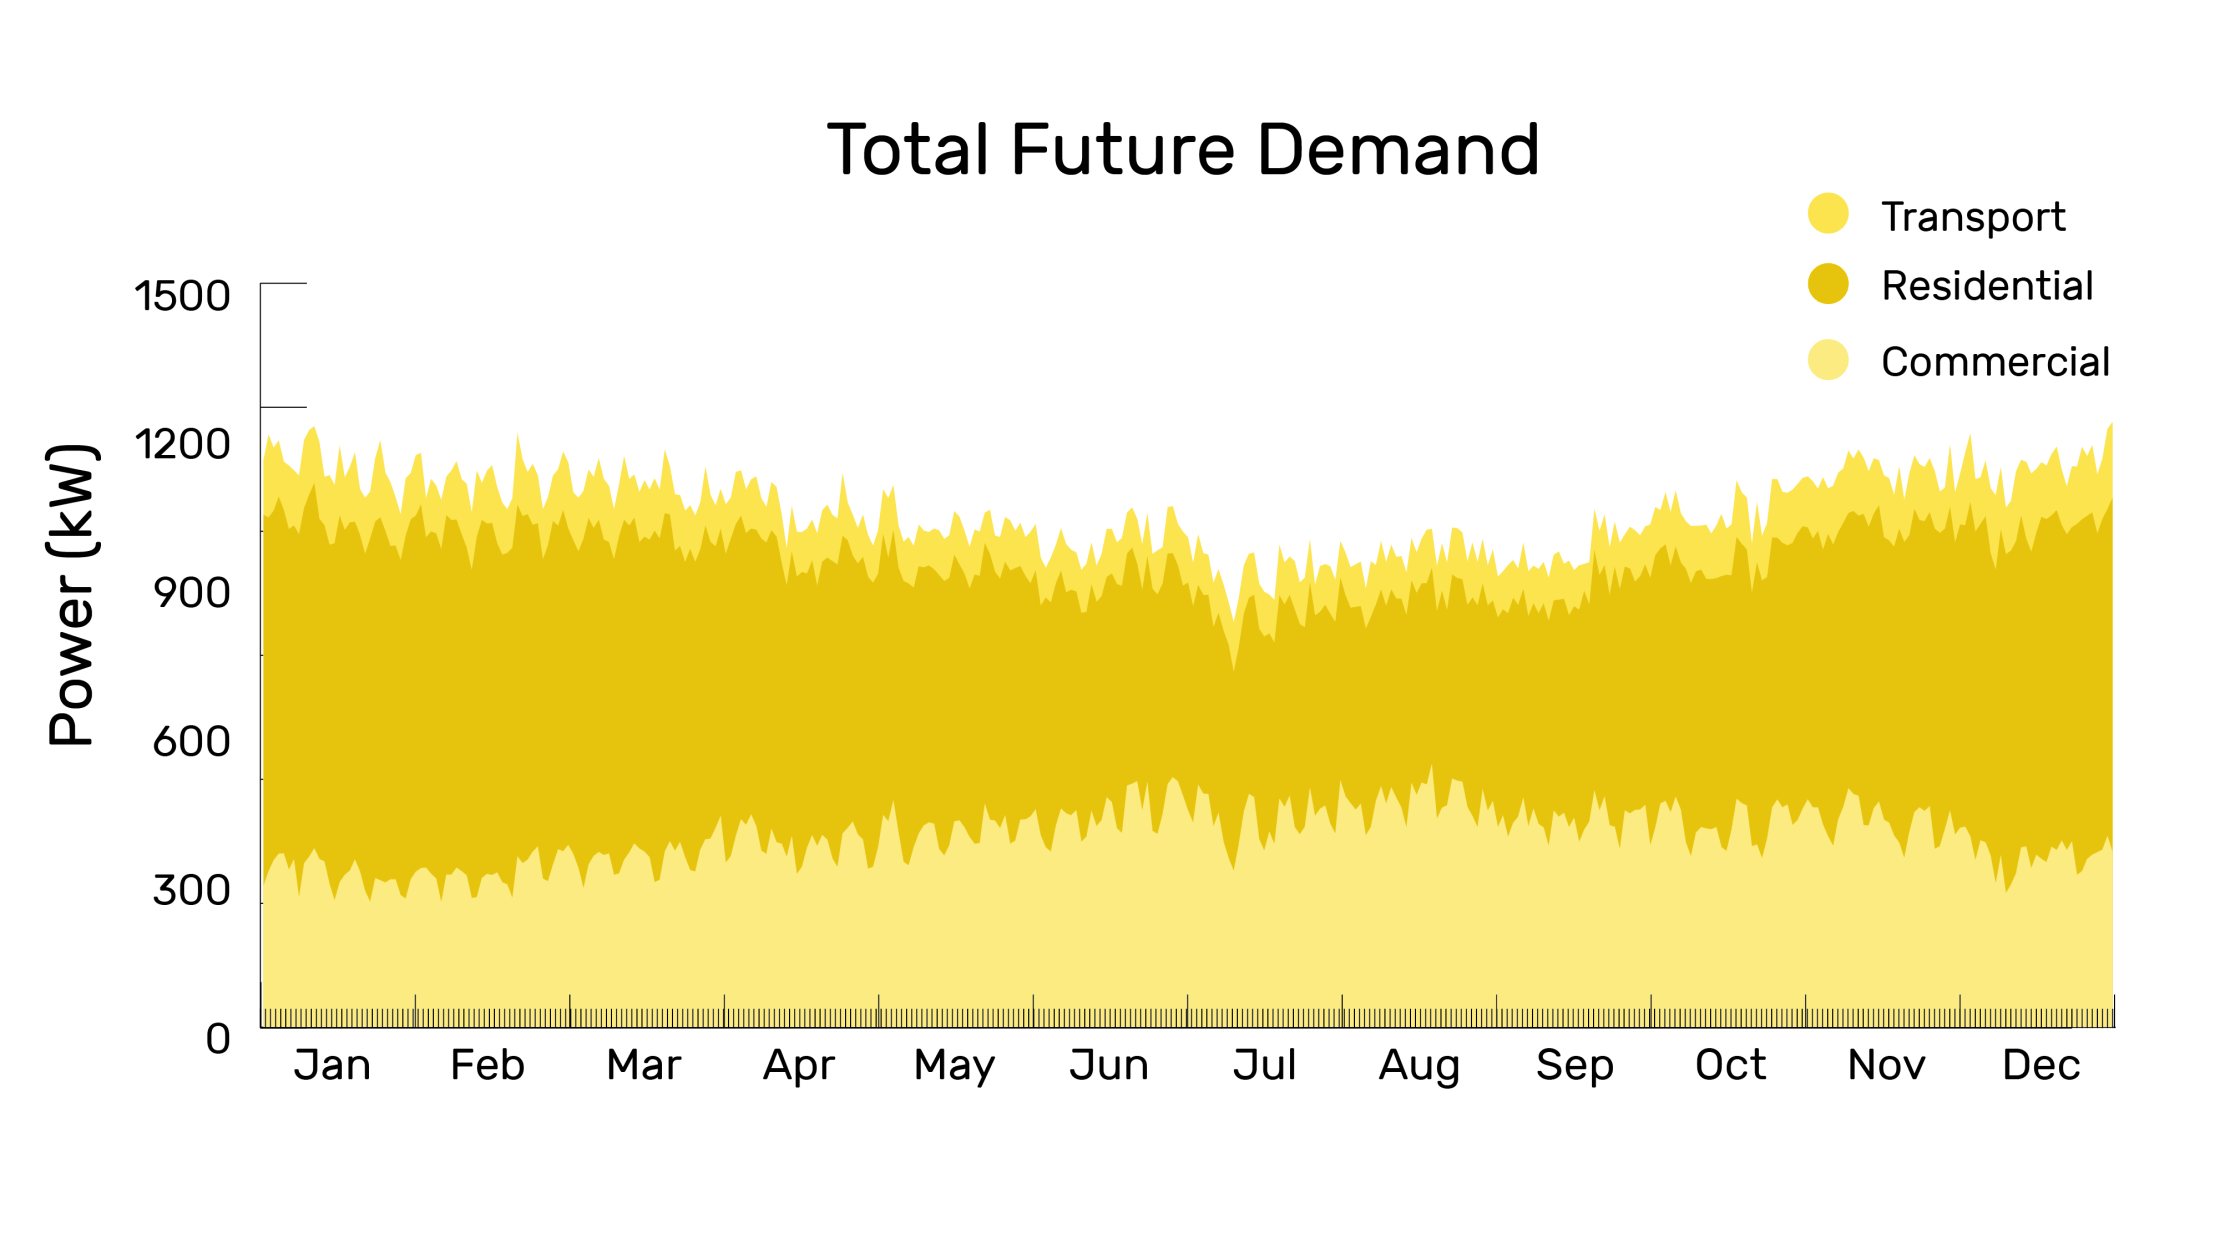
The graph above shows the yearly total future demand profiles of Kinlochleven after retrofitting the dwellings and electrifying the heating and transport demands.
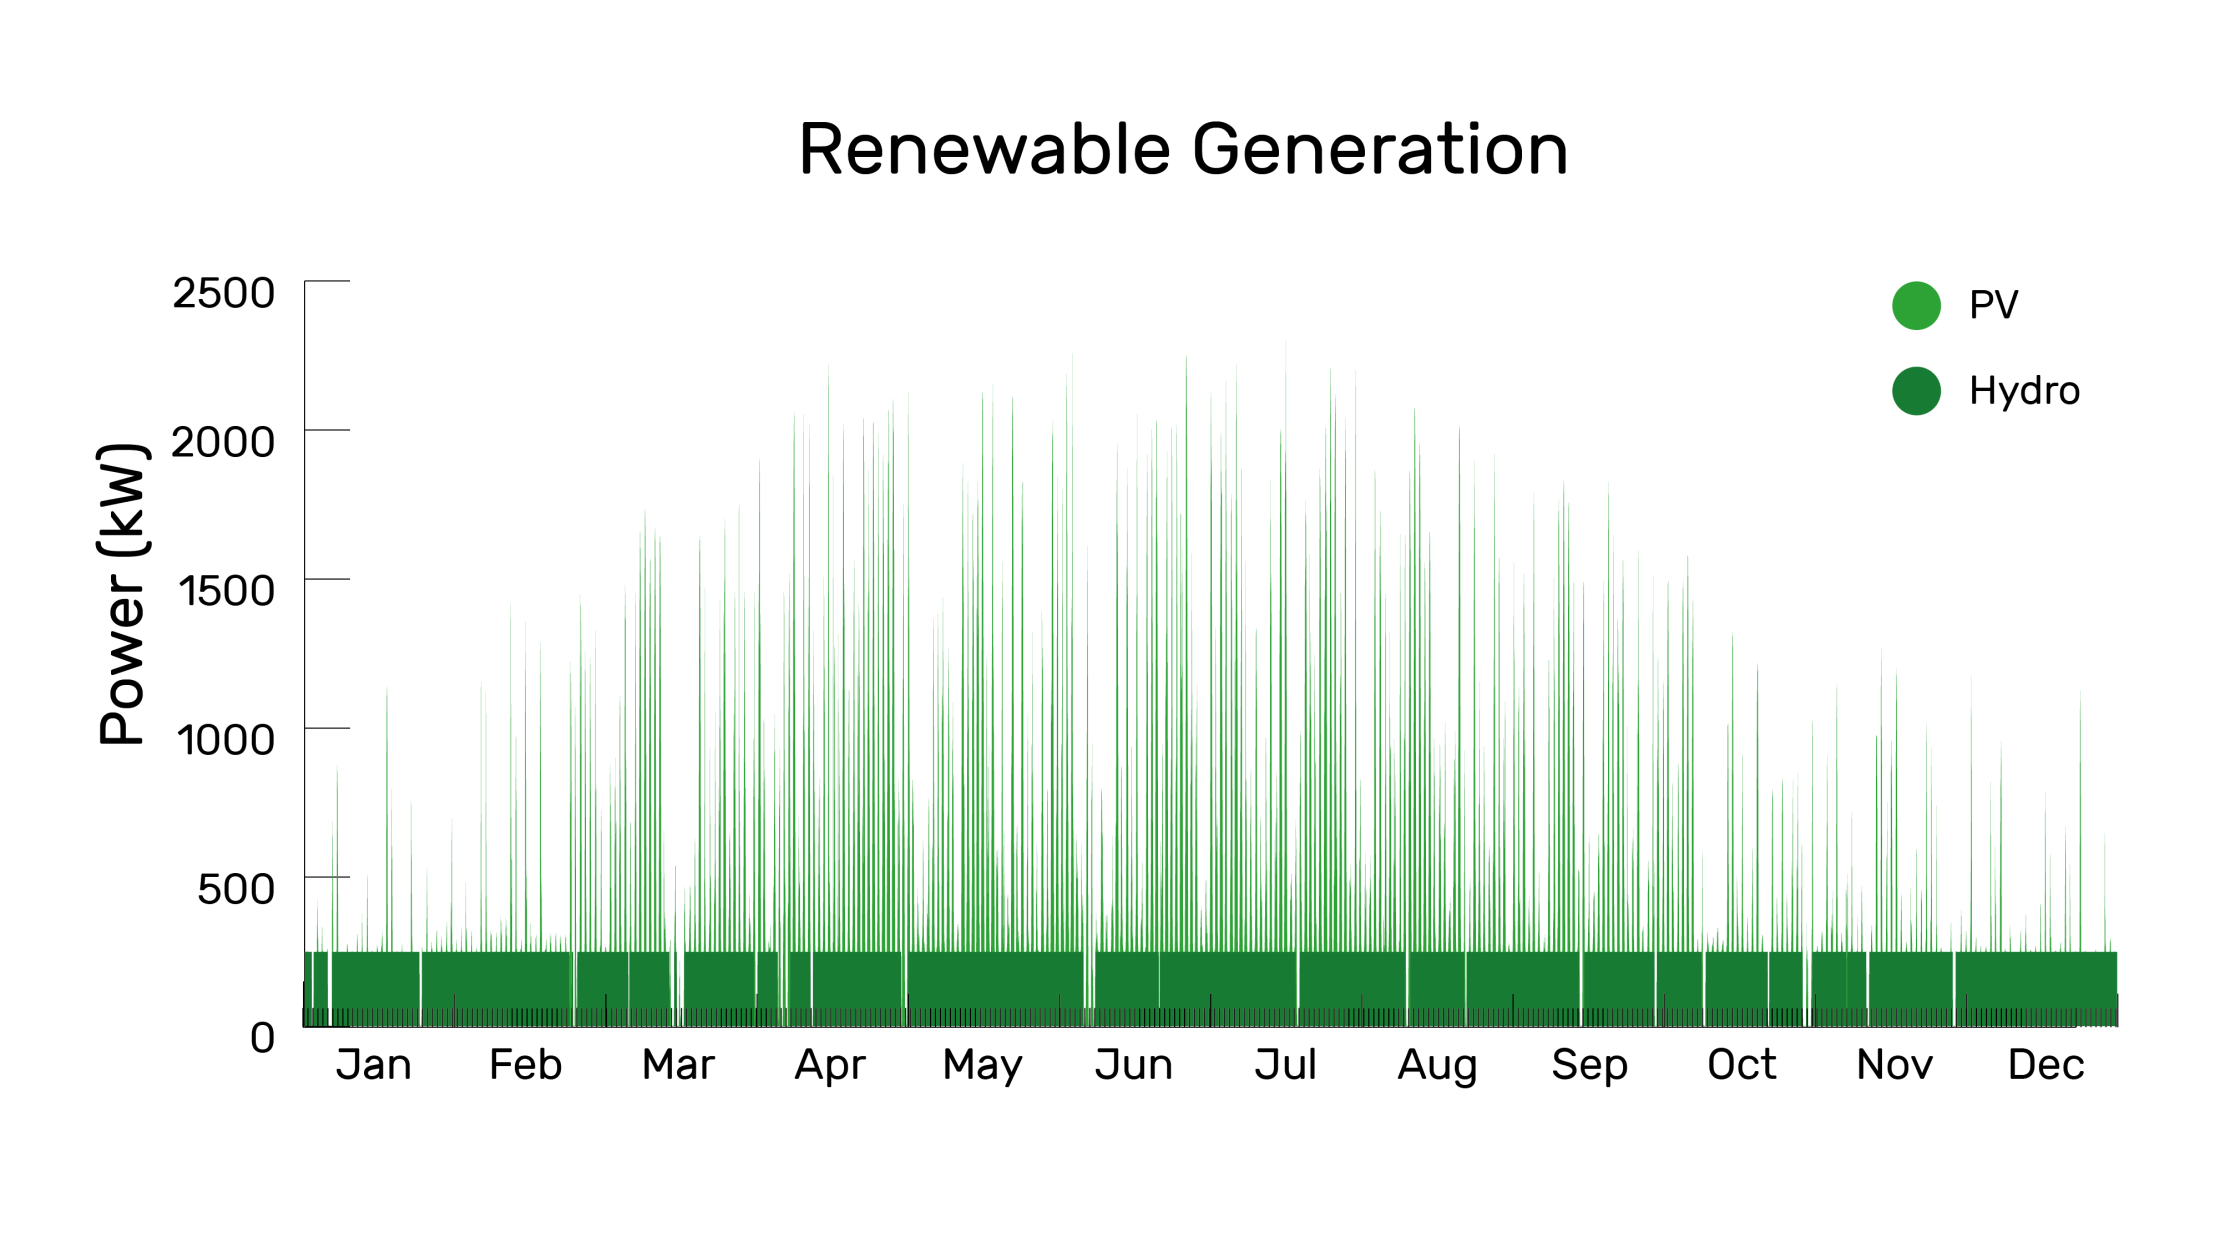
The graph above shows the generation yearly profiles of the proposed PV and tailrace small-scale hydro.
The graph above shows the comparison between the total future demand and the local renewable generation. The local generation can provide 40% of the total future demand.