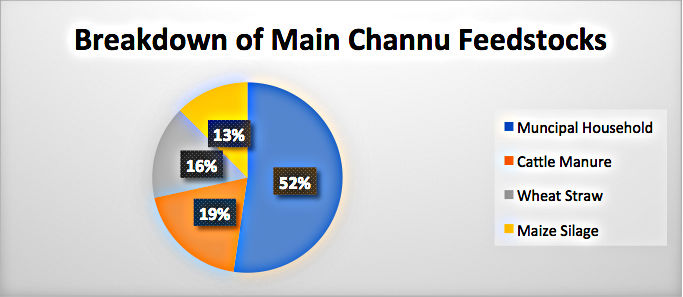
From the literature, it was estimated that the vast majority of the current organic waste in city comes from Municipal Households with approx. 52%, crop residues [30 % which include maize silage and wheat straw], and cattle manure is around 19 %. (Raheem, Hassan and Shakoor, 2016). Refer to Figure 1.
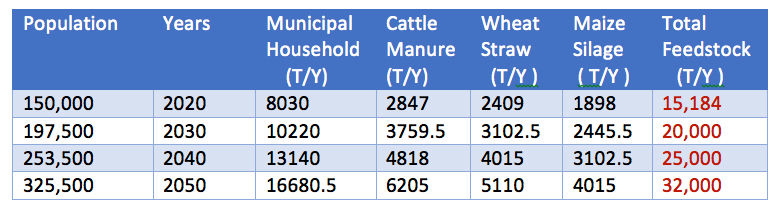
It was also assumed that the average waste per person in the Punjab region ranges between (0.2 to 0.6) kg/person/day, taking into consideration the population of the city of Mian Channu is 150,000. It is therefore anticipated that the current municipal waste is 8030 tonnes/per year (Uddin et al., 2016).
Furthermore, from a comparable study conducted in Bosan town which has populations figures similar to Mian Channu, the livestock manure was projected to be around 2847 annual tonnes, considering an average cattle population of 475 cows and buffalo. The owners of the cattle farms estimate one animal produces about 6 tonnes of manure annually (World Bank, 2010). In addition, an estimation of current agricultural wastes found to be 2409 annual tonnes for wheat straw, and 1898 annual tonnes for maize silage (Uddin et al., 2016).
As the population is expected to grow intensively in upcoming years, the organic waste is also anticipated to rise sharply, reaching approx. 32,000 tonnes/year in 2050. Table 1 below demonstrates projected organic wastes growth in Mian Channu for the next 30 years.
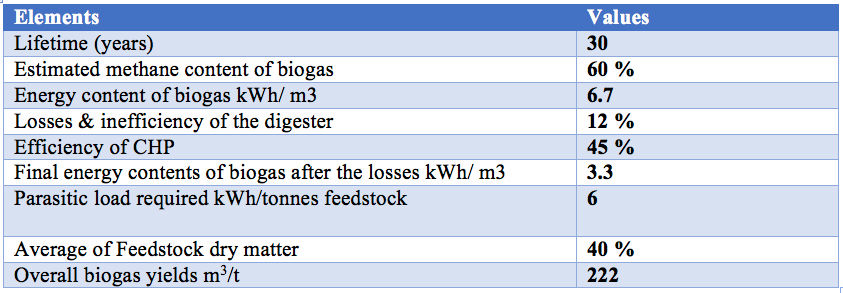
In this study, the software tool- Anaerobic Digestion Economic Assessment, has been used to calculate the biogas and electricity generation outputs. This tool is designed by NNFCC Consultancy to assist anaerobic digestion developers in evaluate the viability and optimisation of different options. Table 2 displays elements which have been assumed and taken into consideration:
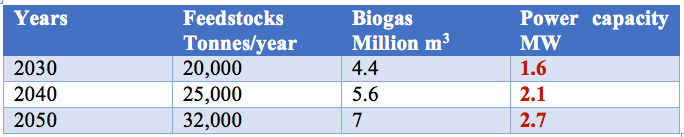
After accounting for all mandatory data regarding the feedstock and biogas, the anaerobic digestion assessment tool was run to evaluate the conversion from feedstock, to biogas and electricity generation, which resulted in Table 3 below.
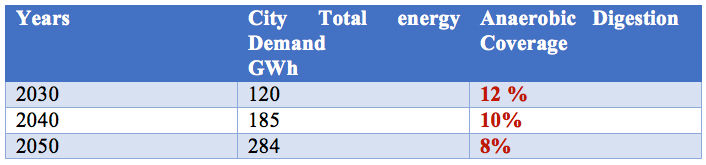
In order to see how much the anaerobic digestion can cover from the city total demand, it was projected that the city total electricity demand in 2030, 2040, and 2050 will be 120 GWh, 185 GWh, and 284 GWh respectively. Also, the total annual electricity generation from the anaerobic digestion in 2030, 2040, and 2050 was calculated as 14 GWh, 18.5 GWh, and 23 GWh respectively. Table 4 below states the percentage that the anaerobic digestion can cover from city total energy demand.

Department of Mechanical and Aerospace Engineering
James Weir Building, Level 8
University of Strathclyde
5 Montrose Street
Glasgow
G1 1XJ
Scotland, UK
+44 (0) 141 548 4851
mae@strath.ac.uk