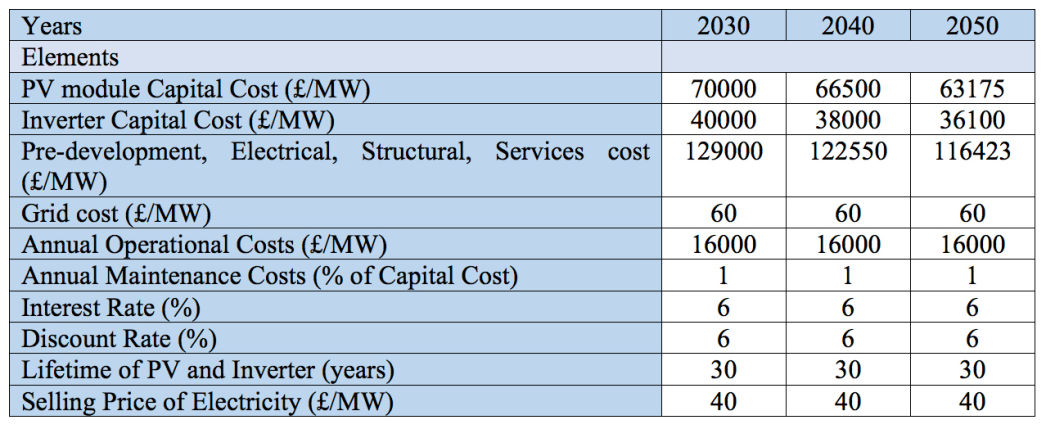
The boundary limits that were set in order to carry out the financial analysis are presented in Table 1 below. The values for the elements presented in the table were based on future predictions for the costs of implementation of large-scale PV farms for the years of 2030, 2040 and 2050. Despite it being impossible on accurately predicting these future values, since they depend on a number of different elements which cannot be controlled, some energy companies provided their predictions, and the most pessimistic values were taken in order to construct this table.
Using the boundary limits presented in Table 1 above, a detailed annual cash flow for the various generation capacities simulated for years 2030, 2040 and 2050 was performed across the entire lifetime of the PV farm, which was considered as 30 years. An example for 2030, of the most important elements deducted from the cash flow are presented in Table 2 below.
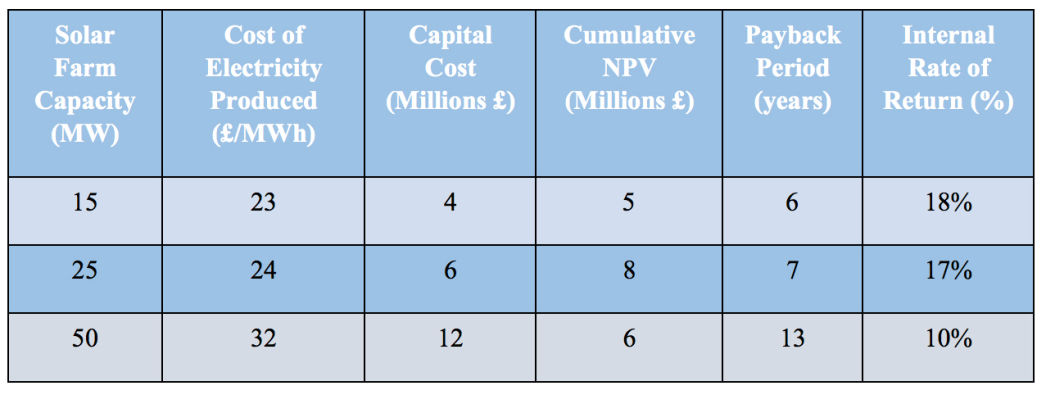
The same procedure was carried out for different PV generation capacities to be added on in the cases of 2040 and 2050.
As presented in the last row of Table 1 in the boundary limits section, the selling price of the electricity generated by the PV farm during off-peak hours was set at £40/MW. This is a very low value compared to the current selling price of electricity during off-peak hours which is at £70/MW. The electricity price which the people of the city will be willing to pay in the future is very uncertain and is impossible to predict as it depends on a wide variety of different factors. This uncertainty for the future selling price initiated the need for a sensitivity analysis to be performed on the selling price against the net present value and the payback period of the project.
An example of the sensitivity analysis performed for the 25 MW PV capacity for 2030 is shown by Figure 1 below.
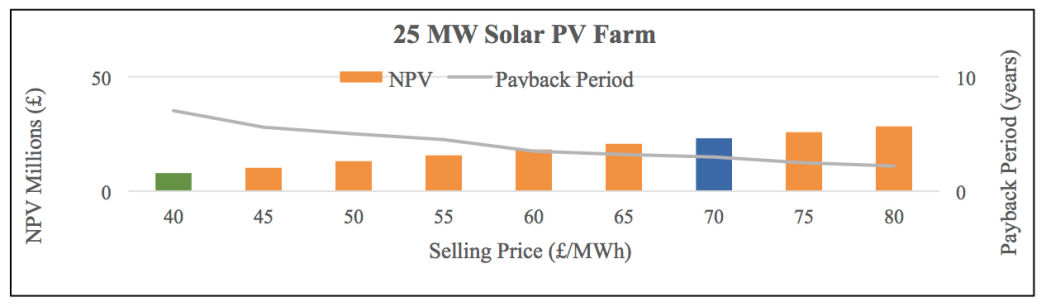
The column highlighted in blue indicates the current selling price of electricity and the column highlighted in green is the selling price of electricity used to carry perform the cash flow. It can be seen from the figure that in the case that the selling price does remain the same in the future years, the project will become even more attractive and profitable as the net present value (NPV) increases from approximately 8 million to a value of almost 23 million. In addition, the payback period of the project will decrease from 7 years to approximately 3 years.
This is a further indication that the implementation of a solar PV farm can definitely be a profitable and attractive investment from private companies or the municipality to invest in.

Department of Mechanical and Aerospace Engineering
James Weir Building, Level 8
University of Strathclyde
5 Montrose Street
Glasgow
G1 1XJ
Scotland, UK
+44 (0) 141 548 4851
mae@strath.ac.uk