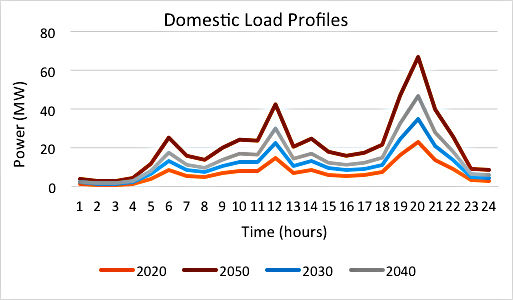
Figure 1: Domestic load profile of the city from 2020 to 2050
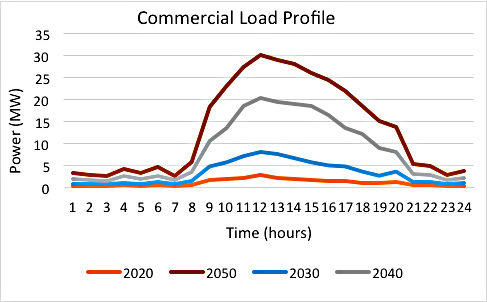
In order to simulate a number of generation capacities for the PV farm, initially the future commercial and domestic load profiles were needed to be generated. Figure 1 presents the change in the domestic load profiles of the city from 2020 to 2050 and Figure 2 presents the change in the commercial load profiles of the city from 2020 to 2050.
The combination of the commercial and domestic load profiles presented in Figure 1 and 2 above was used to create the city load profiles for 2030, 2040 and 2050 to perform the simulations.
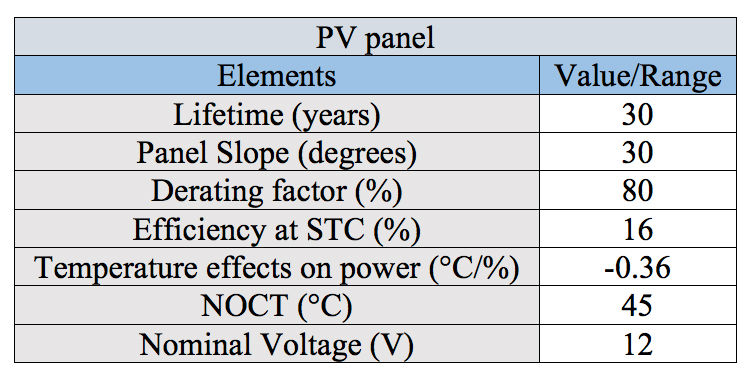
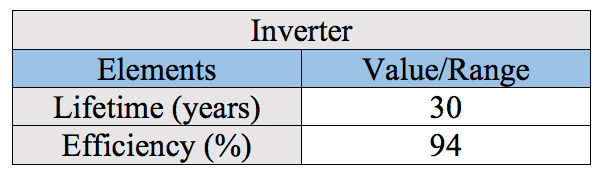
The boundary limits that have been set as the first step of the technical analysis are presented in Tables 1 & 2. Table 1 indicates the boundary conditions set for the PV panels and Table 2 indicates the boundary conditions set for the inverters.
Following the simulations performed for generation capacities of 15, 25, and 50 MW for 2030, a three-day example of the demand/supply matching during the summer period is shown by Figure 3 below.
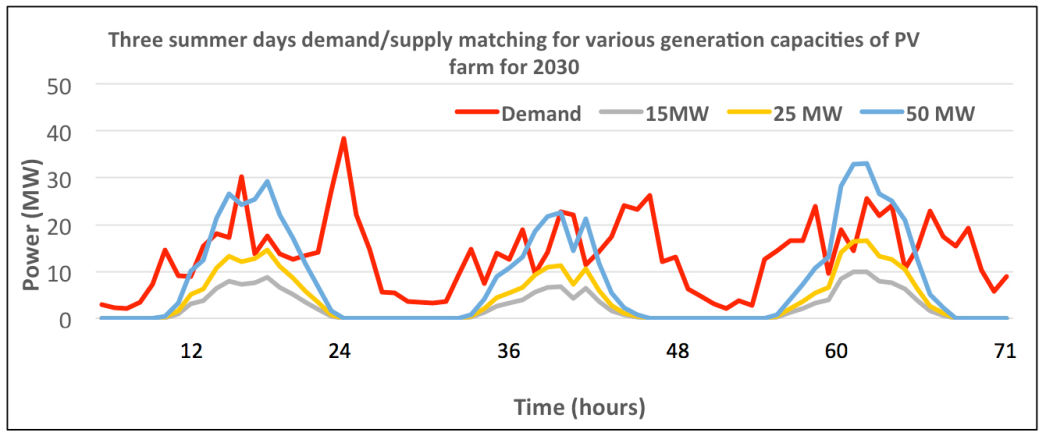
The most important point of information that can be derived through the demand/supply matching procedure is that despite the 50 MW PV capacity covering a larger amount of the city’s energy demand, there are substantial periods of time where there is a surplus of energy generation, which can be translated to wasted energy since the PV farm will be directly connected to the city. This wasted energy increases during the winter period, since the city’s energy demand is even lower due to the lack of cooling loads.
In this case, the 25 MW PV capacity looks like the best option out of the three capacities simulated, due to covering a larger amount of the city’s energy demand than the 15 MW capacity, while having minimal to none wasted energy generation associated with it.
The same procedure was performed for different PV generation capacities in the cases of 2040 and 2050.
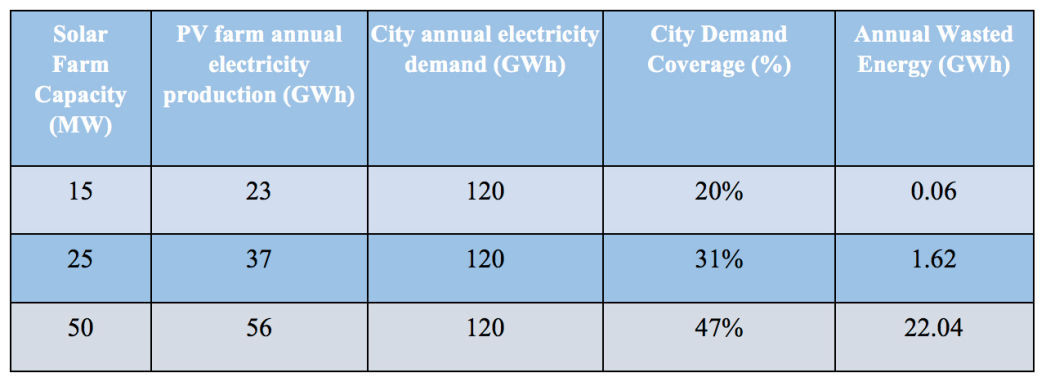
Following the demand/supply matching step, the values of annual electricity generation were deduced for each of the generation capacities of 15, 25, and 50 MW for 2030; additionally, the percentage of the city’s energy demand covered was calculated for each. The results of the last step of the technical analysis are presented in Table 3 below.
The same procedure was performed for different PV generation capacities in the cases of 2040 and 2050.

Department of Mechanical and Aerospace Engineering
James Weir Building, Level 8
University of Strathclyde
5 Montrose Street
Glasgow
G1 1XJ
Scotland, UK
+44 (0) 141 548 4851
mae@strath.ac.uk