Hydrogen as a zero carbon emissions fuel provides a fuel source for greener generation. By replacing fossil fuel sources with hydrogen we completely remove the carbon emissions previously produced from them sources. This section looks at the extent of decarbonisation that hydrogen could achieve.
A Single SEnS Combined Unit
One SEnS combined unit providing peak electrical demand as a Short Term Operating Reserve (STOR) as well as a fuelling station could replace the need for current fossil fuel supplies consisting of a diesel generator and a conventional petrol station. Calculations of the carbon dioxide equivalent savings per one combined unit were based on the information from the Greenhouse gas reporting - Conversion factors 2016 provided by the UK government. [1]
To calculate the CO2 equivalent of a typical 3 MW diesel generator, the average biofuel blend diesel has been chosen. The refuelling station was assumed to serve half of its capacity to diesel cars and the other half to petrol cars. For both parts, biofuel blend was considered, as this is a common fuel used in the UK. Since the unit operated on hydrogen it produces zero carbon emissions. In contrast, a 3MW diesel generator used for two hours, three times a week would generate 15 tonnes of CO2 each week and a petrol station with 150 cars visiting each day would produce 126 tonnes of CO2. [2] [3] Therefore a single SEnS combined unit would save 141 tonnes per week and 7,355 tonnes of CO2 per year (Figure 1).
To calculate the CO2 equivalent of a typical 3 MW diesel generator, the average biofuel blend diesel has been chosen. The refuelling station was assumed to serve half of its capacity to diesel cars and the other half to petrol cars. For both parts, biofuel blend was considered, as this is a common fuel used in the UK. Since the unit operated on hydrogen it produces zero carbon emissions. In contrast, a 3MW diesel generator used for two hours, three times a week would generate 15 tonnes of CO2 each week and a petrol station with 150 cars visiting each day would produce 126 tonnes of CO2. [2] [3] Therefore a single SEnS combined unit would save 141 tonnes per week and 7,355 tonnes of CO2 per year (Figure 1).
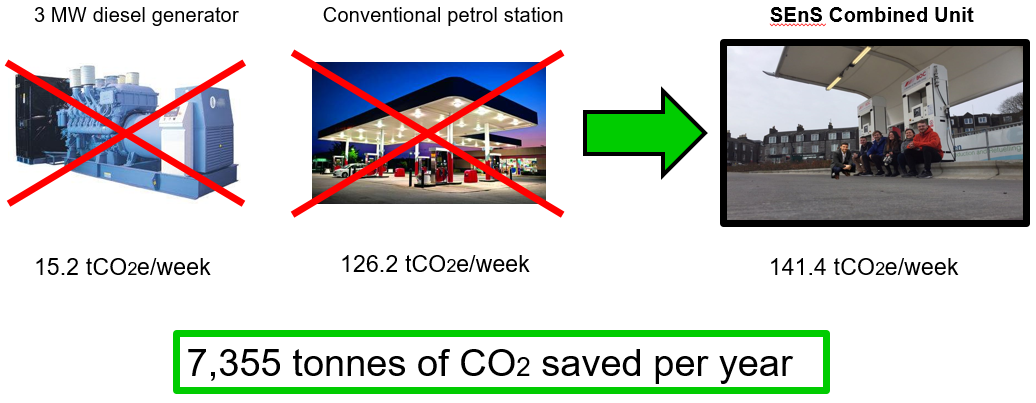
Figure 1. Emissions reduction of SEnS combined unit compared to the current situation
The bigger picture
If the SEnS combined unit were to be deployed nationwide, we would contribute a proportion of decarbonising UK emissions. This section looks at the extent the combined unit would decarbonise the grid based on a nationwide roll out of the unit. Additionally, the peak electrical standby aspect of the unit is investigated, utilising the unit more frequently to meet a larger proportion of peak demand electrical supply and the resultant decarbonisation. All calculations are shown in the downloadable excel spread sheet at the end of this page.
Transport
In the future, for a greener Britain we could completely decarbonise the road transport sector by using Fuel Cell Hydrogen Vehicles (FCHVs). Given that FCHVs have a similar mileage to regular fossil fuelled vehicles, we assume that all fossil fuelled fuelling stations would be replaced by hydrogen fuelling stations. There are 8490 petrol stations currently in the UK. [4] These existing stations would be replaced with our SEnS combined unit into each (Figure 2). By replacing these fossil fuelled fuelling stations with zero carbon emitting hydrogen, the UK transport sector would emit 110 million tonnes of CO2 per year based on figures from 2016. [1] [5] This is a reduction carbon emissions in the transport sector of 69 %.
NB. Electric Vehicles (EVs) are not included in this prediction for ease of the model
NB. Electric Vehicles (EVs) are not included in this prediction for ease of the model
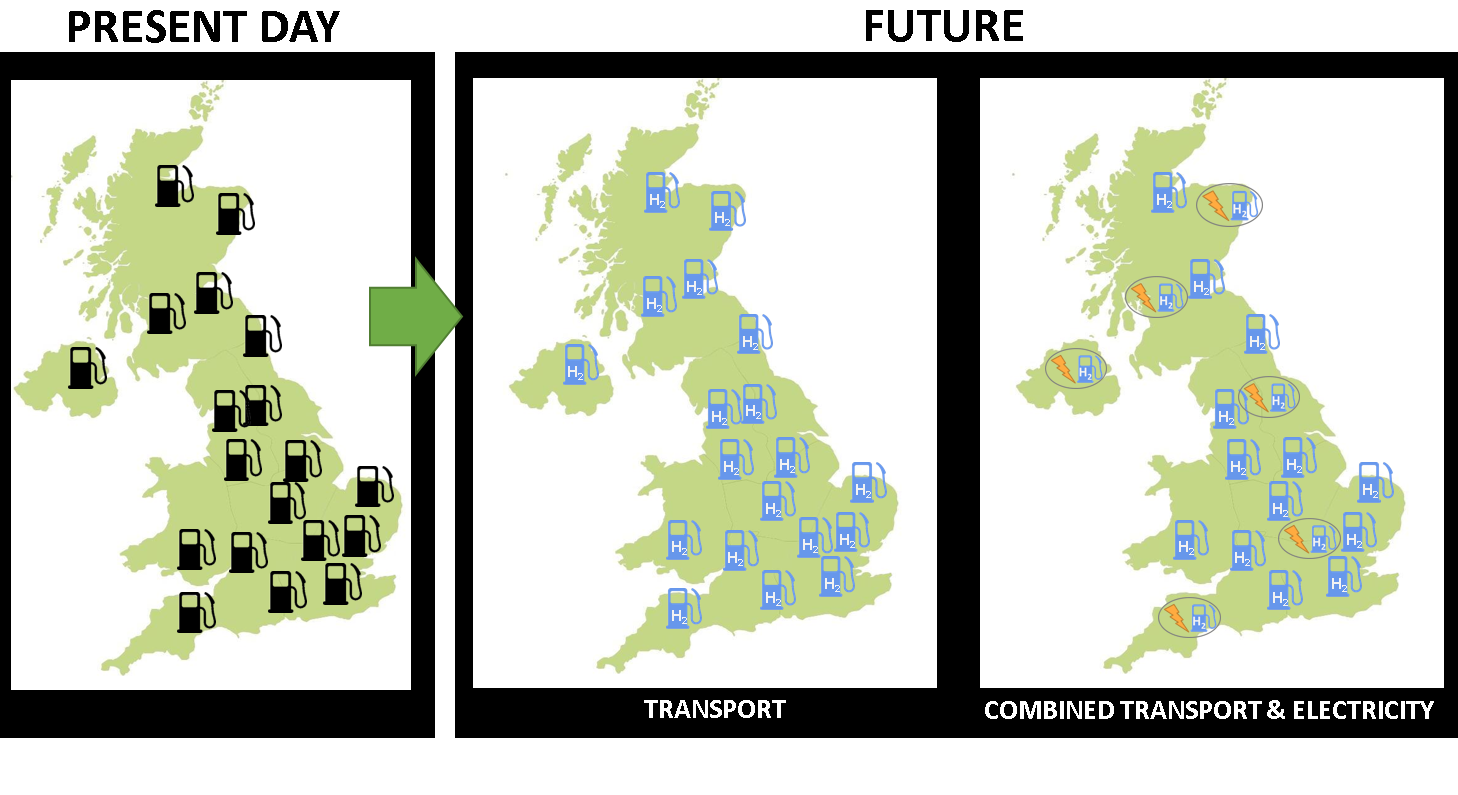
Figure 2. Conventional petrol stations in the UK replaced by SEnS refuelling stations and combined units
Peak Electricity Demand
Energy generation can be divided into three categories as depicted in the Figure 3. These are the baseload, usually supplied by coal or nuclear; intermediate peaking, supplied by combined cycle gas turbines (CCGT); and fast peaking, supplied by CCGT and pumped hydro. [6] The STOR units operate in the upper end of the fast peaking demand and are usually supplied by disel generator. Hydrogen fuel cells fit into the fast peaking section of demand supply.
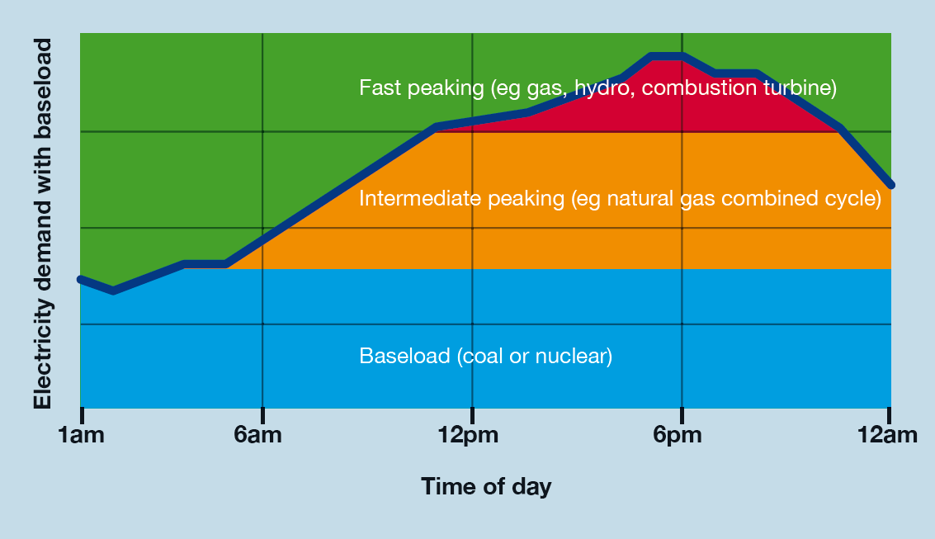
Figure 3. Energy generation divided into three categories [6]
Currently, the STOR activation margin is set at 48 GW (red line, Figure 4) which means standby plants are not activated until the demand reaches 48 GW. [7] Based on the demand profile for 2016, [8][9] these standby plants are used only 0.9% of the time annually and would require 174 hydrogen standby plants sized at 6MW (the minimum size of STOR contract). Using hydrogen standby plants for a peak demand margin of 48 GW would decarbonise UK demand by 0.01 %.
To utilise these standby plants more often, the margin could be lowered. For the standby plants to be used 50 % of the time, the margin would need to be 32 GW (yellow line) and would require 1006 plants. If these were all hydrogen plants, UK demand would be decarbonised by 2 %.
If the units were active 100% of the time, therefore functioning more like CCGT suppling the intermediate and fast peaking demand rather than a short term operating reserve, then the margin could be lowered to 15 GW (green line). 2890 units would be required and this would decarbonise the grid by 20 %.
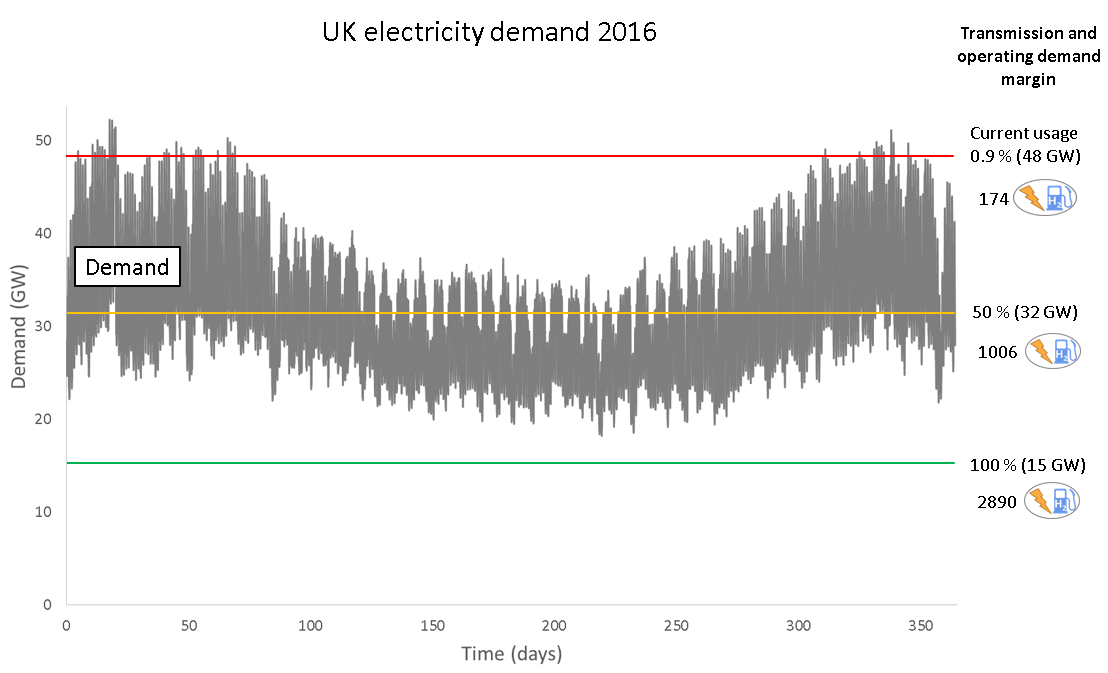
Figure 4. UK Demand profile in 2016
Combined Decarbonisation
Utilising hydrogen units close to 100 % of the time for grid balancing purposes would require 2890 fuel cells fitted to around a third of the existing filling stations in the UK if these were all converted to hydrogen refuelling stations with plenty more stations available for retrofit for future increase in demand.
Having a combined system on this scale would decarbonise the transport sector by 69 %, electrical sector by 20 % with an total reduction in carbon emissions for the UK of 22.3 million tonnes of CO2, which is 18 % overall (Figure 5). [10]
Having a combined system on this scale would decarbonise the transport sector by 69 %, electrical sector by 20 % with an total reduction in carbon emissions for the UK of 22.3 million tonnes of CO2, which is 18 % overall (Figure 5). [10]
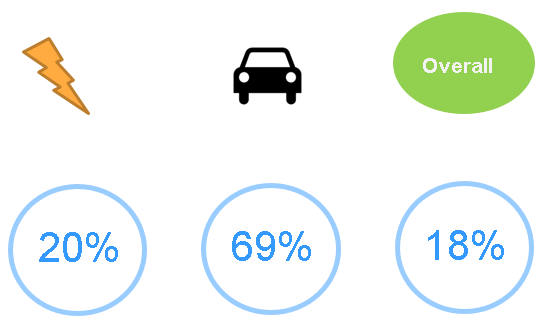
Figure 5. Proportion of decarbonisation by sector if SEnS combined unit was widely implemented
[1] https://www.gov.uk/government/publications/greenhouse-gas-reporting-conversion-factors-2016
[2] http://nationalpowersupply.com/powergenerators/ourgenerators.html;
[3] http://www.kessel.com/solutions/petrol-stations.html
[4] https://www.statista.com/statistics/312331/number-of-petrol-stations-in-the-united-kingdom-uk/
[5] https://www.gov.uk/government/statistical-data-sets/env01-fuel-consumption
[6] http://energypost.eu/dispelling-nuclear-baseload-myth-nothing-renewables-cant-better/
[7] http://www2.nationalgrid.com/uk/services/balancing-services/reserve-services/short-term-operating-reserve/
[8] http://www2.nationalgrid.com/UK/Industry-information/Electricity-transmission-operational-data/Data-Explorer/;
[9] http://www.gridwatch.templar.co.uk
[10] https://www.theccc.org.uk/charts-data/ukemissions-by-sector/
| bigger_picture.xlsx |