-
Introduction
Local communities have a key role in the energy efficiency revolution we are living
They can unlock opportunities for tackling climate change and lower energy bills through joint energy projects and investment that would otherwise be missed. UK Government believes that local ownership of renewable energy projects will increase rural incomes and increase the resilience of rural businesses, and, for the first time, the Renewable Energy Roadmap highlights the role of community energy in meeting the UK’s future renewable energy targets.
In this context, Findhorn Community is looking at new ways of electricity generation due to its growing energy demand and its continuous goal of zero net carbon emissions. At present, Findhorn Wind Farm provides a considerable amount of the total electricity consumed in Findhorn Community; however, wind power generation is variable due to the unsteadiness of the wind resource. This variability means that Findhorn Community imports power from the grid when there is lack of wind, or otherwise export it into the grid when there is excess of power.
The fact of importing electricity from the grid when wind power generation is not enough to satisfy the demand makes Findhorn Community dependable on fossil fuels and also on the variability of market energy prices.
Therefore, new ways of energy generation are analysed in order to fill the voids that the Wind Farm causes. The new technology options to be considered would have to comply with the following requirements:
- Renewable and Predictable Resource
- Low Carbon Emissions
- Low Environmental Impact Technology and Deployment
- Adequate Scale and Cost
This way, the members of Findhorn Community will get further benefits from the community energy project and the possibility to sell their own electricity.
-
New ways of electricity generation
In the current setting, we have looked at the different renewable energy technologies and their suitability for Findhorn Community.
As a local community, the new power solutions should be in accordance with its necessities and resources.
The key factors taken into account at the time of selecting or discarding a new technology are:
- Predictable Resource
- Steady Resource
- Low Environmental Impact Technology and Deployment
- Adequate Scale and Implementation and Maintenance Costs
- Grid Connection
- Enough quantity of energy to significantly reduce imports from the grid
Moreover, the possibility to integrate the new energy project to available schemes and grants should be as well considered, but in this case, it has not been included in this scope. For more information about funding for local communities' renewable energy projects in UK click here.
Electricity Generation New Options

More onshore wind turbines
 The Community members are already familiarised with the Onshore Wind Turbines and installation costs and connection to the grid would not be a problem for this option. Moreover, it is a mature technology and it can generate large amounts of power.
 Increasing the power capacity will be translated into greater annual energy generation but no into an increase of the community energy autonomy. In addition, an increase in the number of turbines would need an upgrade of the local grid.
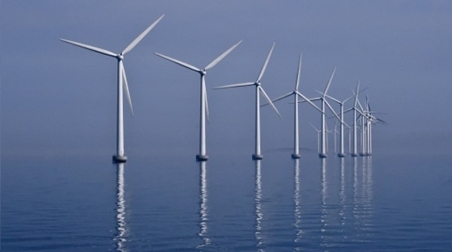
Offshore Wind farm
Offshore breeze is much stronger and steady than the onshore one. Moreover, offshore winds can be strong in the afternoon, matching the time when electricity demand rises, helping to reduce the imports in that period.
Not applicable to small/medium scale development, due to its high overall cost. Possible negative impacts for the local sea wildlife.
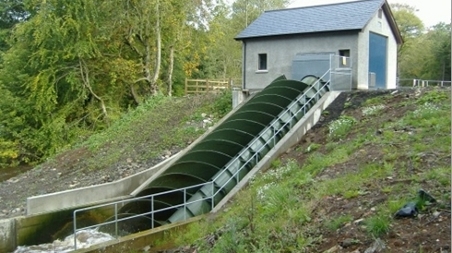
Micro-Hydro
Best cost-effective option and mouldable power output to enhance the Community energy autonomy. Very mature technology and well recognized for small communities.
An optimum location for the installation of a small scale hydro power plant has not been found after site exploration due to the River Findhorn flat morphology in an area of at least 5 miles around the Community.
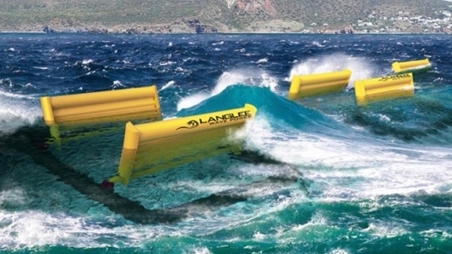
Wave Energy Devices
Adequate for small scale and low cost option when using devices like the one presented in the photo.
Waves are not considerably predictable so there is the same problem of intermittence than with wind power. Moreover, this is not a very mature technology with high cost-effectiveness ratio. Also, it introduces the necessity to go offshore with problems for maintenance and grid connection.
Tidal Barrage
It has been proven that the large tidal range in the area, and the bay morphology is optimum for the installation of a tidal barrage plant, whose power output is predictable and due to the site configuration could cut the Findhorn Community grid energy inputs.
Large negative impacts to salmon and sea wildlife, big changes in sediment transportation and thus severe alterations in the whole ecosystem and area morphology. Temporal inundation of the bay shores and effect in the local business and recreation activities.
Tidal Stream Energy Device
Predictable resource, high site potential, low scale options available. Low environmental impact where carefully located and properly designed, installed and maintained.
There is not the possibility of generating great quantity of annual energy due to the limited depth of the area. Possible impacts to sea life.
Finally, the TIDAL STREAM POWER has been considered as the most appropriate new generation technology for the necessities and particularities of Findhorn Village. This decision has been influenced largely by the knowledge of the presence of strong currents in the Findhorn bay due to the daily changes in the tidal range.
For more information about renewable energy technologies for local communities in UK, consult:

-
The Tidal Resource
When addressing a new renewable energy project, there is the issue of predicting when the supply will be available and in what quantities so that it can be matched with the other generation sources to meet the demand. This poses a problem for technologies dependent on intermittent and variable resources such as wind, solar and wave, whose predictability is limited due to the stochastic variability of the weather conditions.
Nevertheless, tidal range and tidal stream are dependent on deterministic astronomical forces rather than weather conditions, so it allows to predict tidal variability with considerable accuracy over the entire life of the project.
Tides are generated by the rotation of the earth within its ocean envelope as shaped by the gravitational and centripetal fields of the moon and sun. The moon’s gravitation creates tidal 'tractive forces' that creates two 'bulges' in the earth’s ocean envelope: one bulge on the side of the earth facing the moon and the other on the opposite side of the earth.

Nooa Ocean Service Education
Solar effects on tides are considerable on the height of the tide and the direction of the tidal bulge according to the phases of the moon, but the combined lunar-solar tidal bulge is predominantly lunar. Tides are named as 'Spring tides' when earth, moon and sun lie approximately on the same line at the times of new and full moon, and whose ranges are greater than average. In Great Britain coasts, spring tides occur from about one to one and a half days after full or new moon.
On the other hand, mid-way between spring tides, the moon is at first and third quarters and therefore sun’s tidal forces act at right angles to the moon’s tidal forces, creating lower high tides and higher low tides. These are the 'Neap tides', whose ranges are less than average.
Rotation of the earth within these 'bulges' result in semi-diurnal tides (two high tides and two low tides per day) near the equator, and diurnal tides at high latitudes, as shown in the figure below. Mid-latitude locations experience mixed tides, with two tides per day, but with significant diurnal inequality between successive high waters and successive low waters.(Hardisty, J., 2009)
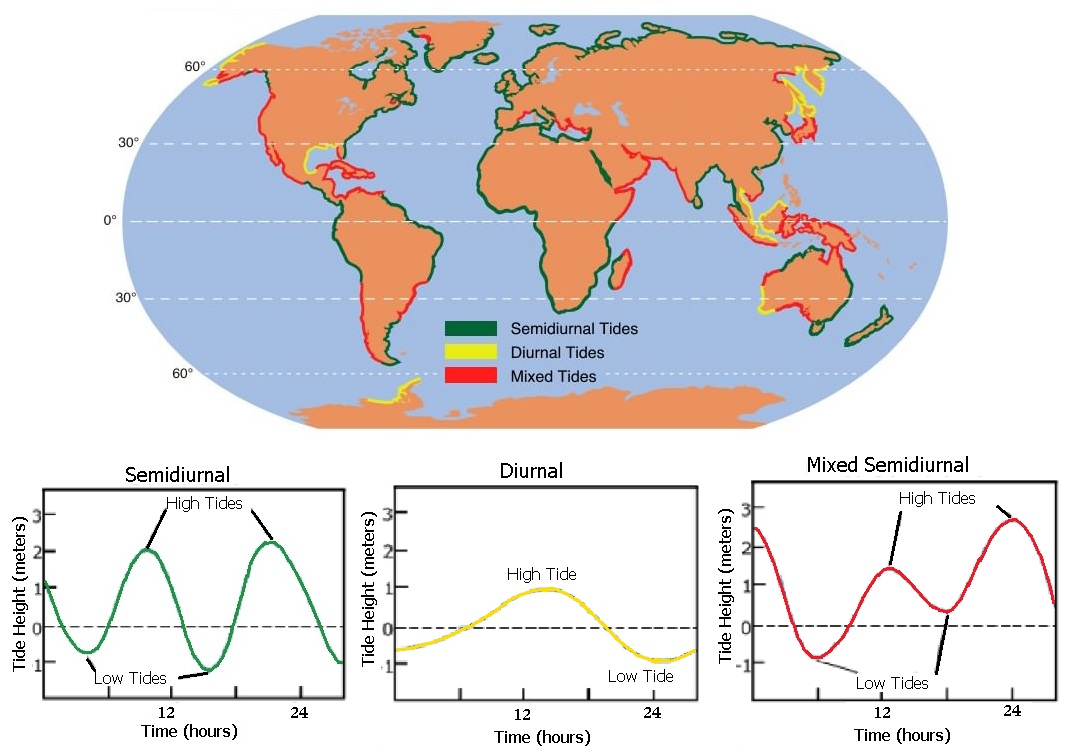
Notice that the different global distribution of tidal types along the oceans reduces the capacity factor of a power plant depending on the location it is placed. In this way, tidal conversion devices placed at significant diurnal inequality locations, such as Mexico both coasts or North American west coast, will have less capacity factor than in other locations with predominantly semi-diurnal tides as Great Britain or North American east coast.
References
Nooa Ocean Service Education (2012) "Tides and Water Levels". US National Oceanic and Atmospheric Administration.
Hardisty, J. (2009) "The Analysis of Tidal Stream Power". ISBN: 978-0-470-72451-4 Wiley, February.
Bryden, I.G., Couch, S.J., Owen, A. and Melville, G. (2009) "Tidal current resource assessment". Proceedings of the Institution of Mechanical Engineers, Part A: Journal of Power and Energy, Volume 221, Number 2 Professional Engineering Publishing, April
-
Tidal Stream
A tidal stream or current is the periodic movement of water in a horizontal direction that is due ultimately to the same astronomical causes as the tide (whereas the tide is a movement in the vertical direction).
Tidal currents can have 3 states:
- Flood Current: currents flowing from the ocean to the shore
- Ebb Current: currents flowing from the shore to the ocean
- Slack Water: current having little or no horizontal motion
The direction of the tidal current will depends on the direction of the tidal wave however, in channels and straits; current is constrained to flow up and down the channel.
If slack waters happen at the time of maximum and minimum tidal height, the profile of the currents is called a standing wave. Instead, if the maximum current velocity happens at the same time as the maximum tidal height and minimum velocity at the same time as minimum tidal height, the profile of the currents is called a progressive wave.
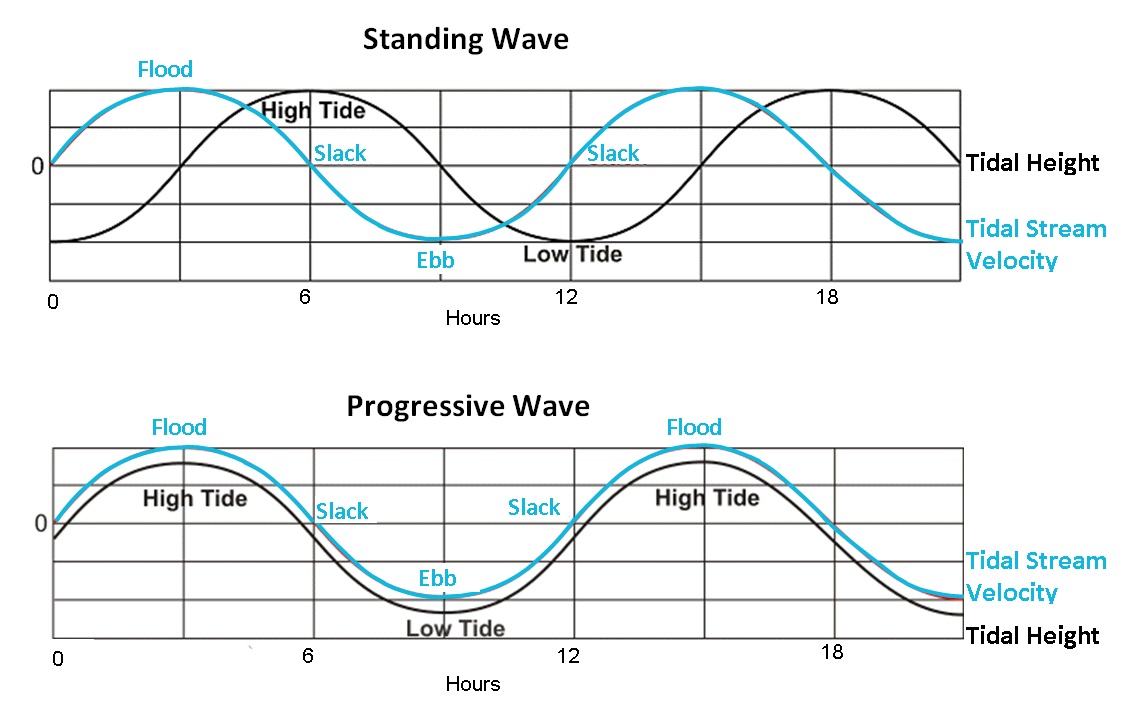
Because the tidal currents are created by the same forces which cause the tides, the currents can be predicted in the same way as the tides. However, the exact relationship between the times of high and low tides and the maximum current or slack water is unique to each location and cannot be determined from a generic rule.
Extracting Energy from the Tide
The extraction of energy from coastal tides can be achieved in two main ways. The first involves the construction of a barrage across an estuary (or bay) to exploit the rise and fall of the tide. The second refers to the deployment of tidal stream energy devices to extract energy from the tidal currents.
Tidal barrage power technology takes advantage of the height differences in the tide range.
During the flood, the sluice gates are opened and the basin level increases, and will close at the point of high tide. Then, once there is enough water head difference between both sides of the barrage, sluices gates are open and the turbines extract energy from the discharged water .
Tidal stream energy devices draw energy from tidal stream in the same way as wind turbines draw energy from air currents. However, the potential for power generation of tidal currents is of the order of 800 times the potential of the air breezes, due to the higher density of water. It means that with average current speeds of 0.5 - 1 m/s, the suitability of a certain location can be assessed.
Although it is still an immature technology still developing, and there are several types of tidal stream energy, The European Marine Energy CentreAQUIII recognizes six principal types of tidal energy converter: horizontal axis turbines, vertical axis turbines, oscillating hydrofoils, venturi devices, Archimedes screws and tidal kites.
References
EPRI (2006) "Methodology for Estimating Tidal Current Energy Resources and Power Production by Tidal In-Stream Energy Conversion (TISEC) Devices". EPRI Guidelines for Preliminary Estimates of Power Production by TISEC Devices. USA, June
Encyclopedia Britannica (2008)
Draper, S. (2011) "Tidal Stream Energy Extraction in Coastal Basins". University of Oxford, UK.
Blunden, L. S. (2009) "Evaluation of Tidal Stream Energy Resources at Sites in the English Channel". University of Southampton.
-
Findhorn Tidal Resource
The history of Findhorn Village cannot be conceived without its relationship with the River Findhorn and bay.
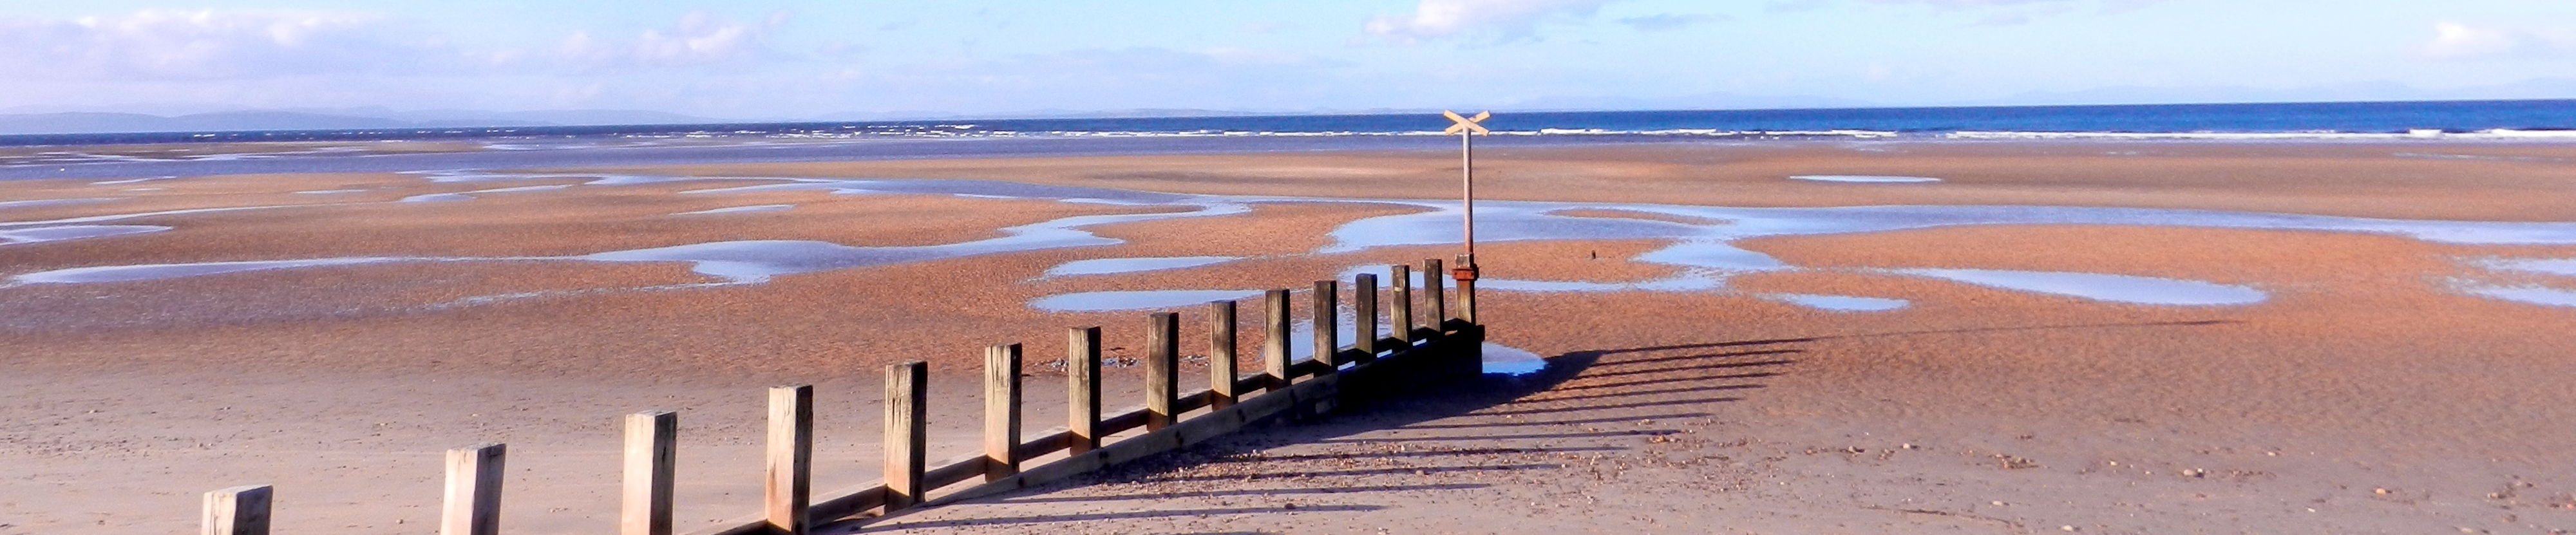
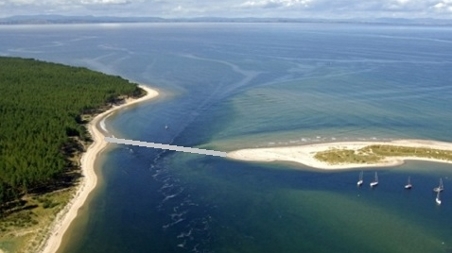
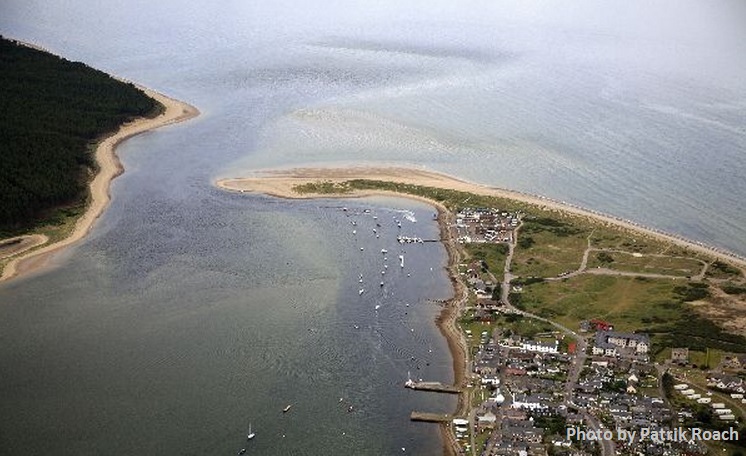 Findhorn Bay
This is such a narrow relation that even the first settlement of the city lies under the sea due to a gradual withdrawal inundation from the earlier site during the late seventeenth and early eighteenth centuries.
Findhorn was for a time an important commercial and fishing port, but changes to the narrow and shallow entrance to the Bay created obstacles to navigation. As the size of trading vessels increased, the volume of trade to the village declined.
Then, the fishing activity predominated and nowadays River Findhorn is one of the most popular locations in Scotland for salmon fishing, being protected by The River Findhorn District Salmon Fishery Board (DSFB).
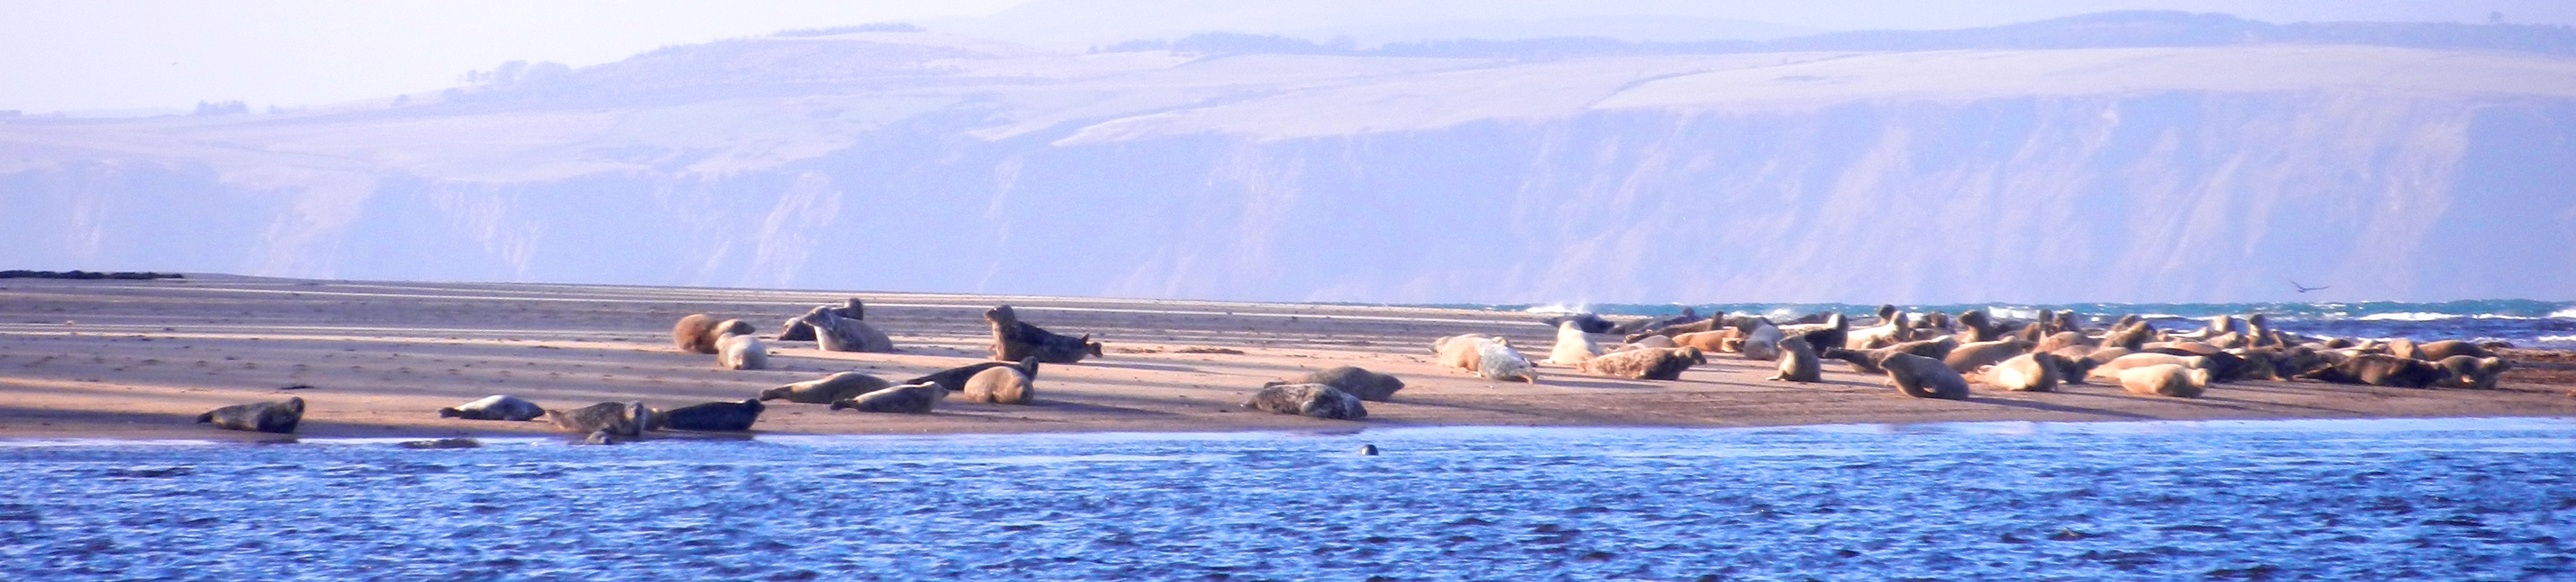
At present, much of the village's life still revolves around the bay, which is one of the major sailing and watersports centres along this stretch of coast. Grey seals have also found their ideal habitat and the west side of the bay is home for a colony of them.
Our aim is to give an added value to Findhorn bay, and make Findhorn to be one of the first local communities to use the energy from the tidal stream (not tidal range) to generate electricity and import it into the net.
Findhorn Bay
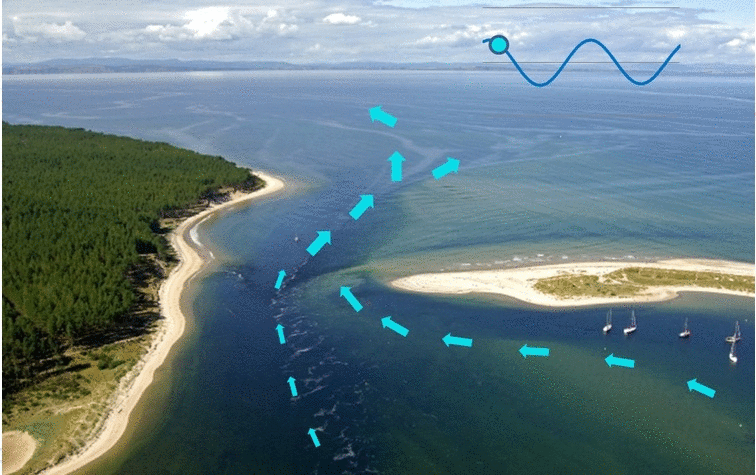
Findhorn bay is characterized by a narrow-mouthed inlet that stretches some two miles south from the sea and opens out to a maximum width of around two miles once inland of the dunes and immediate coastal zone.
River Findhorn and three burns flow into the bay with an annual mean flow of approximately 20 m3/s (Centre for Ecology & Hydrology, 2014).
The bay’s depth varies considerably throughout all the area, and at low tide much of the southern part of it is exposed as mud flats, being an area of special interest for birds and rest of wildlife. The flows seen in the figure represent also the areas where the depth is bigger in both low and high tide.
Findhorn Tidal Resource
Looking to the morphology of Findhorn bay and the noticeable height differences between low and high tide, one might think that its inlet is the perfect location for a tidal barrage power plant. Nevertheless, the negative environmental, economic and social impacts that the construction of a barrage would lead to, make this option to be discarded.
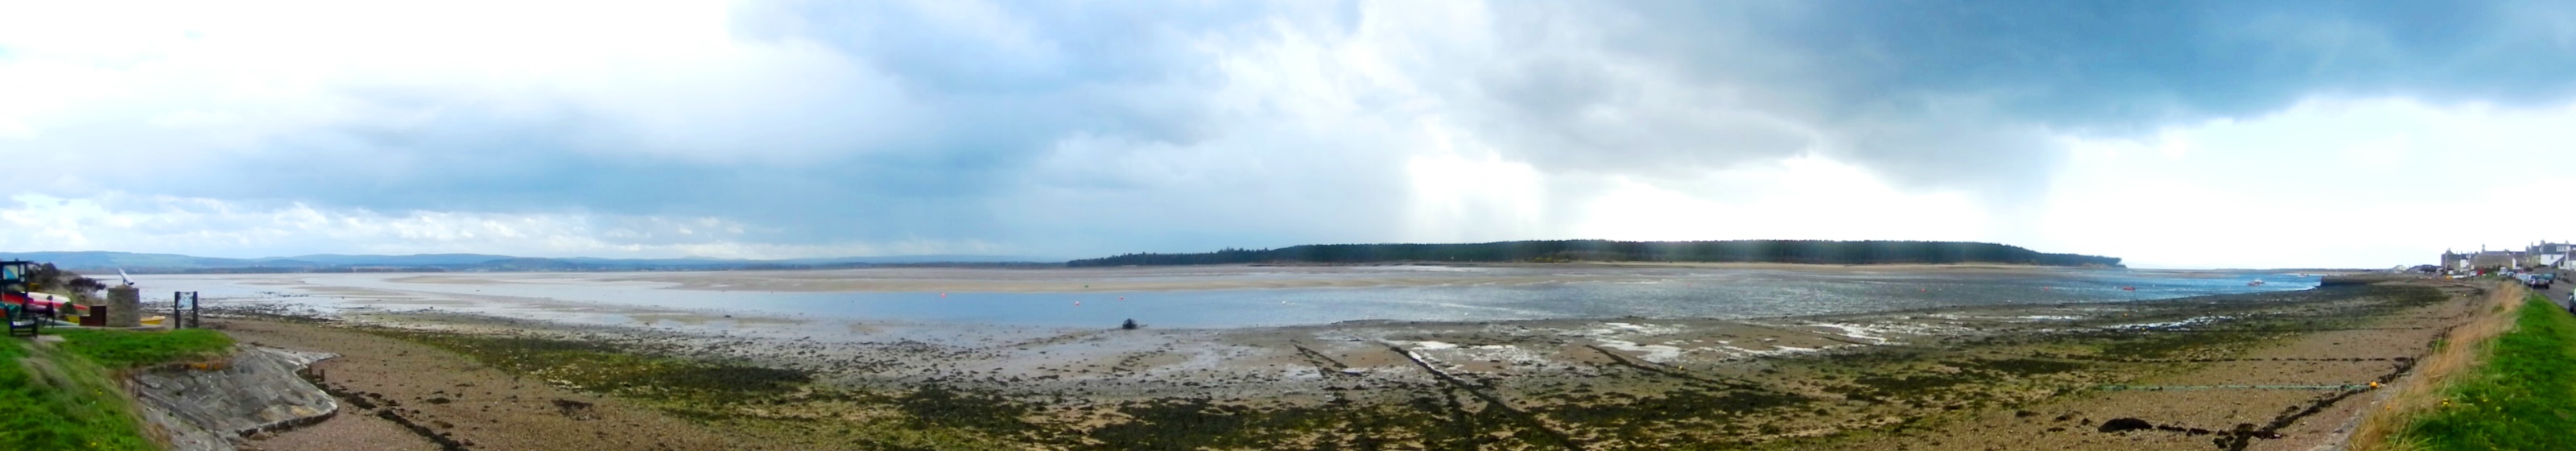 Findhorn bay during low tide
The high tide range which characterizes the bay makes highly probable the fact that the current velocities through the inlet are strong enough to be exploitable by tidal stream energy devices.
This fact was confirmed by the testimony of local people, so we decided to assess the true tidal stream power potential in Findhorn bay. It is important to clarify that the idea of study the potential of the channel itself was dismissed from the beginning due to the fact that placing the tidal energy devices along it might disturb all sailing activities and be a hazard to the wildlife.
Therefore, the tidal stream resource was assessed in closed areas to the channel where the depth was thought to be greater in low tide (which could allow greater rotor diameters and power output).
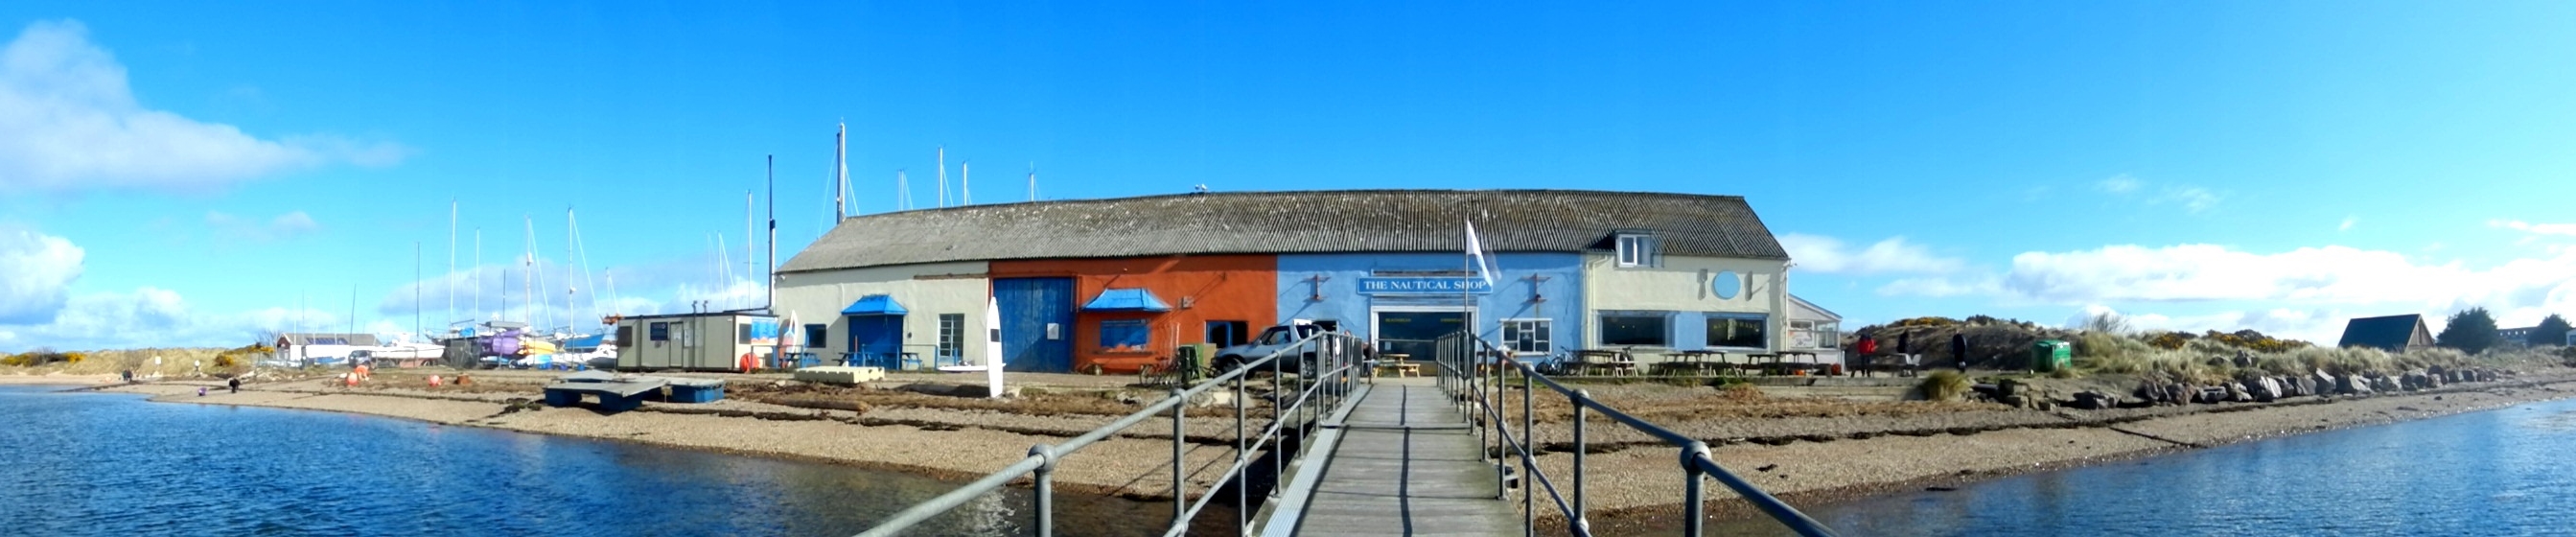
 Low tide next to Findhorn Marine
Historical Data
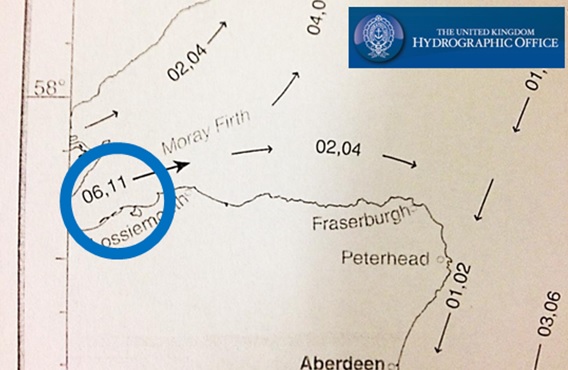
Tidal Stream Data
©Copyright Admiralty Tidal Stream Atlas
No historical data has been found about tidal stream velocities neither for bathymetric in Findhorn bay. Nevertheless, tidal stream data from The Tidal Stream Admiralty Atlas has been analysed for the offshore coastal area closest to Findhorn.
In the table of the right, 'Hw + (number)' means the hours which have passed or left to the High Water in Dover, as a reference point.
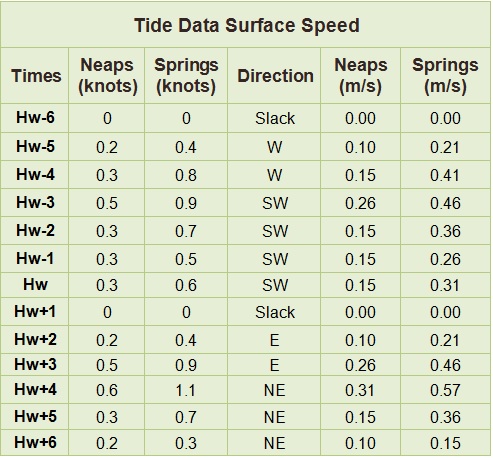 Data from Admiralty Tidal Stream Atlas
As it can be observed, the maximum value of tidal stream velocity offshore is 0.57 m/s in spring tide, and the average velocity results in 0.29m/s, which are too low values for the implementation of tidal stream energy devices.
However, the location concerned is not offshore and Findhorn bay current speed values will be highly influenced by the bay inlet configuration and the differences in tidal heights, rather than offshore stream velocities.
Therefore, looking at data from The Tidal Admiralty Atlas it can be seen that Findhorn has not tidal station, so the tidal heights of the two nearest stations are going to be analysed. The nearest station at the east of Findhorn is Burghead and the nearest at the west is Nairn, as it is observed in the Inner Moray Firth Navigation Chart.
 Data from Marine Chart, British Crown, 2012
Local people and workers of the Findhorn Marine have informed us that tidal stream velocity around the channel is believed to be of a magnitude around 2m/s and depths of 4- 7 m at low tide, depending on the exact location.
Therefore, due to the lack of historical data of tidal stream velocity and water depth, after this first stage of data collection from local people and the tidal Admiralty Atlas, the second stage of the Tidal Resource Assessment was the Field Study.
References
The Admiralty Tidal Stream Atlas: North sea north western part (Ed 4) (2012). The UK Hydrographic Office.
Centre for Ecology & Hydrology (2014). Station 7002 Findhorn at Forres. National River Flow Archive Data.
British Crown, 2012
-
Field Study
According to the local testimonies and data from the Centre for Ecology & Hydrology, it has been identified the potential locations in the bay where tidal currents would be stronger and the depth would be greater. Afterwards, a site survey on current velocities and water depth has been carried out.
For reliable tidal stream data, the survey should be carried out during a typical spring cycle, during the two days with strongest currents. Nevertheless, due to time constrains, it has not been possible, although all measurements have been carried out as close as possible to high and low tides.
According to Tidal Stream, peak and ebb floods precede high and low tides correspondingly for standing wave and concur with high and low tides in the case of progressive wave.
Due to the nature of the place, it is predictable that the strongest tidal currents might concur with the high and low tides times, but it can just be known after an extensive field survey.
This animation recreates the tidal stream intensity and direction which depends on the state of the tide in each moment. It can be observed that when the tide starts to decrease, a stream emerges outward from the bay (blue color) and, on the other hand, when tide starts to rise up, the direction of the current starts to change and fills the bay (orange color)
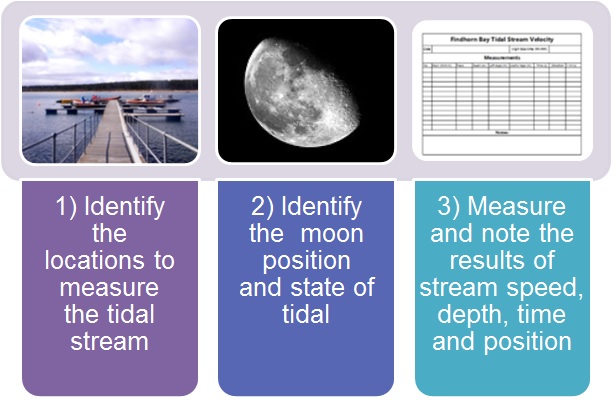
At the right of the screen is presented the procedure we have followed for the field survey:
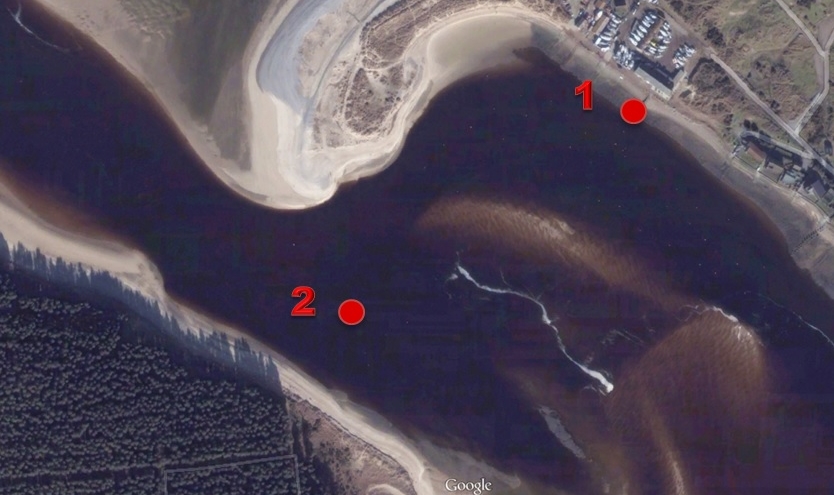 Locations to measure the tidal stream
1) Identify the Locations to measure the tidal stream
Looking to the stronger tidal currents and greater depth, and avoiding the locations where tidal stream energy devices might affect wildlife and navigation routes, the two places for measuring are:
- 1) Pontoon from Findhorn Marine
- 2) In the bay, 125 m prior to the channel entrance, 50 meters from the west shore and 350 m from the Marine pontoon
2) Identify the Moon Phase and State of the Tidal
The dates of the site survey are 13th and 14th of April of 2014. The moon phase for those days was crescent moon, two-three days before full moon, so according to the chapter Tidal Resource, the tide height was approaching to spring tide.
Secondly, tidal time (low and high times) has to be noted. For the survey days, times of low and high tides were the following.

Moonphases on the days when measurements were taken
©Copyright MoonConnection.com, 2014
3) Measurements
First day. Sunday 13th April 2014
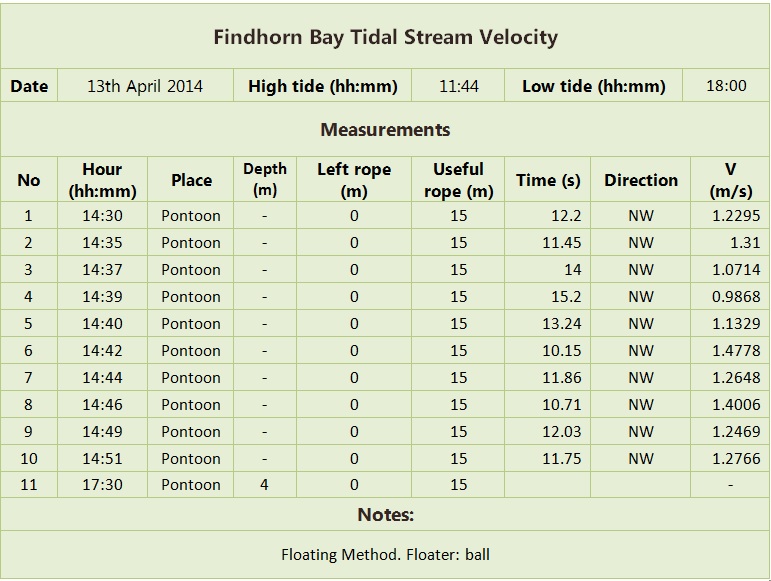
Comments:Two hours 45 minutes after the bay started to be empty (started at 11:44 when high tide), and four-five days before the highest spring tide, the average current velocity under the Findhorn Marina Pontoon is: 1.24 m/s.
In addition, 30 minutes before low tide, the velocity was too low to be measured with the floating system.
Second day. Monday 14th April 2014
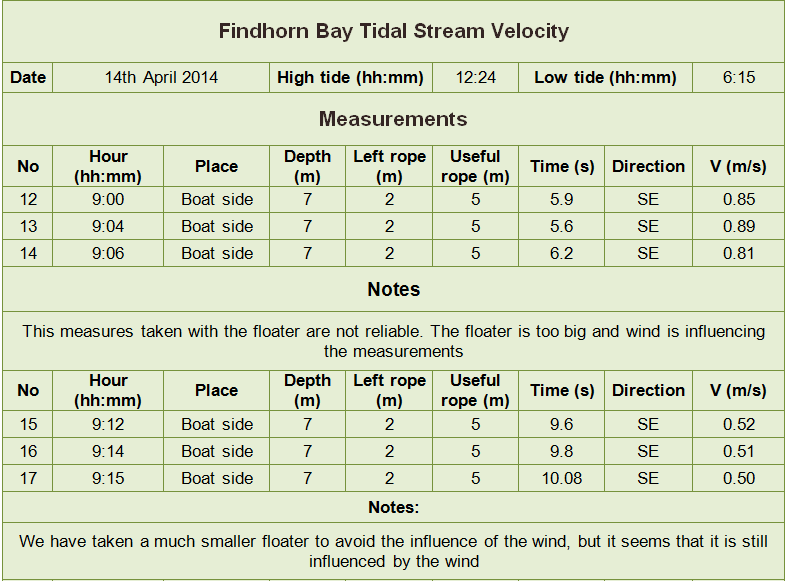
Comments:In the location “2”, 3 hours 15 minutes after the basin started to be full and four-five days before the spring tide, the average current speed one meter deep is 1.62 m/s.
The velocity under the Marine pontoon was too slow to be measured with our system.
Conclusion
Due to the measuring system, the moment when the measurements were taken and the position in the moon cycle, it has been decided to apply a factor of 1.3 to calculate the maximum velocity in the spring cycle. Therefore, the design value for flood current velocity in spring tide is 2.11 m/s.
References
EMEC Orkney (2013) "Assessment of Tidal Energy Resource". The European Marine Energy Centre LTD.
-
Harmonic Analysis
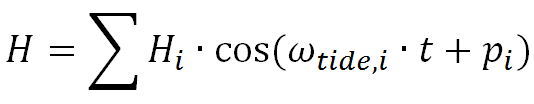
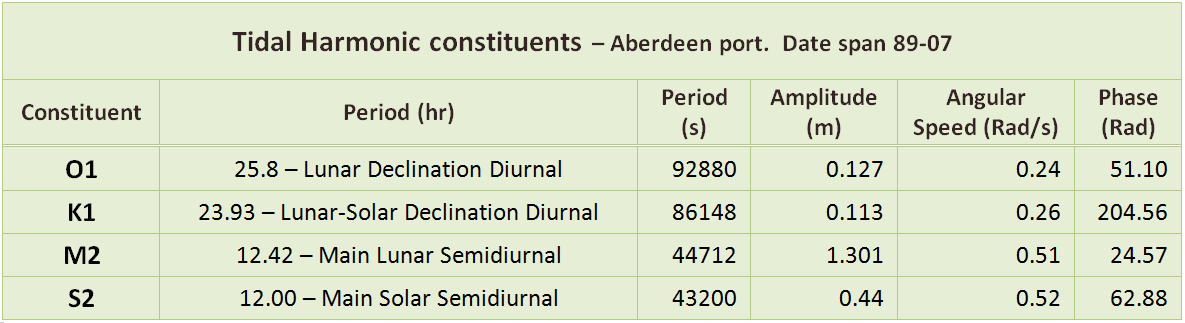
The tides are sinusoidal oscillations containing the effect of all the tidal components. These tidal components are the ones commented in the previous chapters and are referred to the motions of the earth, sun and moon. Each constituent is defined by its period in solar hours and have a determined amplitude and phase depending on the location in earth. Four of the most predominant constituents are shown in the table below and accounts for approximately 75% of tidal activity, although over 400 constituents have been identified.
The partial tides are summarized and represented by the following equation:
These tidal constituents can also be used to describe the type of tide, whether it is semidiurnal, diurnal or a mixture of the two. This is commonly defined using a tidal form number, expressed in the formula below.
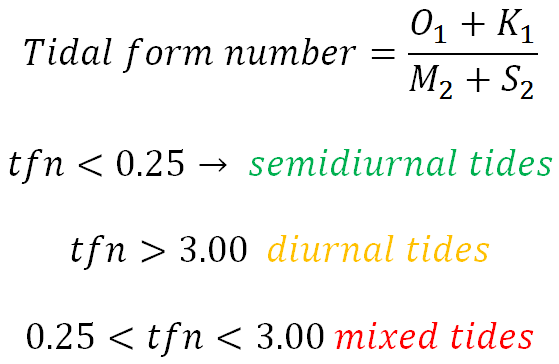
As tfn<0.14 in the location, the tides are semidiurnal, which means that there are two high tides and two low tides per day, as it has been seen in the historical data.
As explained in the Tidal Resource chapter, the tidal currents behave in the same sinusoidal way than the tidal current, as both are caused by the same factors; but with a possible offset depending if it is progressive or standing wave. In this case, it is assumed to be standing wave, and thus it is not considered an offset between the high tide and flood current states. Therefore, the tidal current velocity will follow the same equation:
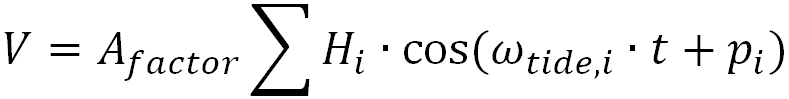
Where Afactor refers to the Amplitude factor, which allows to equate the tidal range equation with the tidal stream one. This factor will make the tidal equation equal to the flood velocity in spring tide.
Therefore, the approximation curve for the tidal stream velocity in Findhorn bay for a typical month is:
Max. Velocity Spring Tide = 2.2 m/s
Max. Velocity Neap Tide = 0.76 m/s
Average velocity in a month = 1.08 m/s
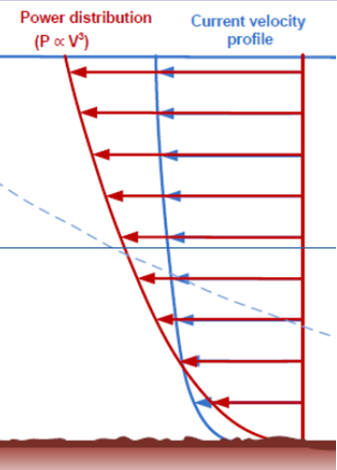
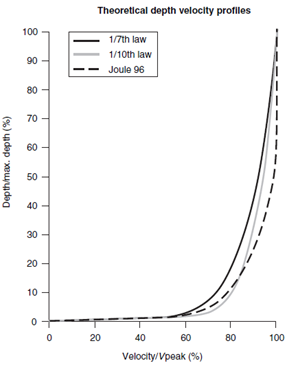
Considerations about velocity depth profile
Tidal stream velocity is supposed to change according to depth following one of the three power laws. The first is the 1/7th, where V0is the speed at the surface (m/s), z is the distance above the seabed (m) and d is the depth (m). The second law is the same formula but with 1/10th rather than 1/7th.
The third law was developed in the JOULE 1996 resource study, which has considered a different velocity profile that gives a higher average flow.
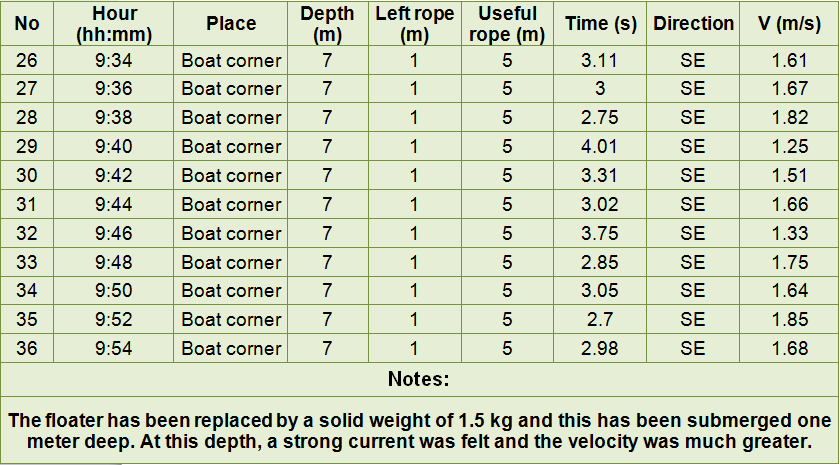
After the field survey, it was noticed that the site velocity profile did not satisfied any of the three power laws, as the current speed was much greater 1 meter depth than at the surface.
This can be explained due to the special characteristics of the location, where the tidal currents are more dependent on the tidal range and the channel features than any other factor.
Therefore, any of the power laws have been applied to this analysis, due to the particular tidal current velocity profile of the location.
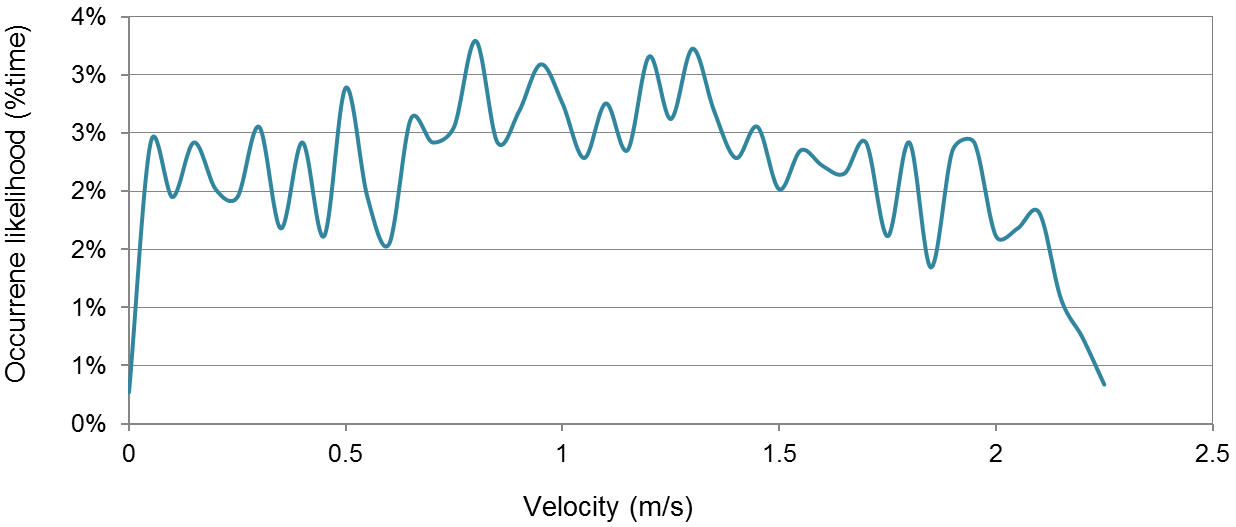
Velocity Distribution
Using the results from the tidal harmonic analysis, a histogram analysis is carried out. The velocity distribution (exceedance curve) is plotted against the occurrence likelihood in a typical month. It can be observed how the greatest % likelihood turns around the velocity value of 1 m/s.
Power
Power Density
The power density available across the surface area considered is calculated from the time series coming from the velocity harmonic analysis, before the histogram analysis, as this will give the most accurate results.
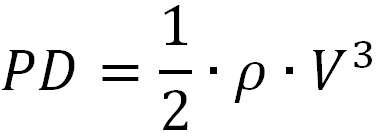
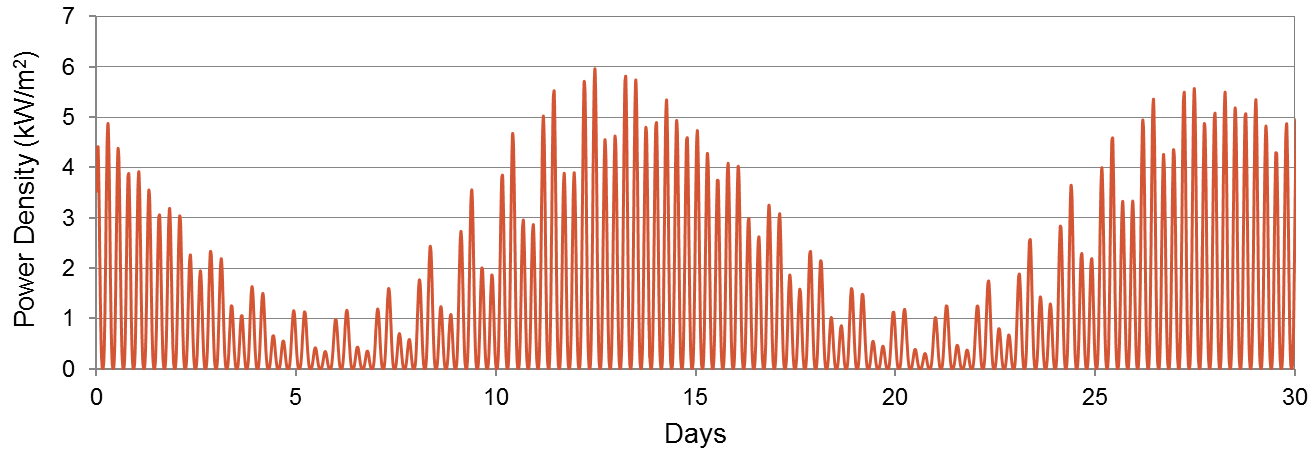
The average power density (APD) is calculated with the following equation:
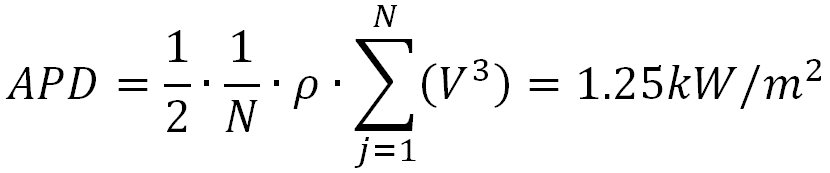
Where j is the index of the 30 min increments, V is the velocity every 10 minutes and N is the total number of time intervals.
References
Saeterstad, M.L. (2011) "Dimensioning Loads for a Tidal Turbine". Norwegian University of Science and Technology, June.
Gooch, S. (2009) "Siting Methodologies for Tidal In-Stream Energy Conversion (TISEC) Systems". University of Washington.
-
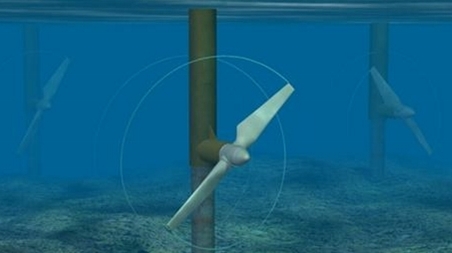
Tidal Stream Energy Device
Once the tidal resource has been assessed, the tidal stream energy has to be selected. Due to the distinctive features and limitations of the site, the recommendations for the selection of the tidal stream energy device are:
Small Scale: due to limitations of depth, environmental concerns and costs.
Vertical Axes: the power output from a horizontal axis turbine is proportional to the square of its rotor radius, therefore these kind of turbines are not recommended where depth is very limited.
Floating Structure: the environmental concerns of the site make non recommendable to do civil works on the seabed, apart from the fact that due to the sandy nature of the place there is a high risk of turbine foundation settling.
Potential Small scale tidal stream energy devices for Findhorn Bay are shown below:
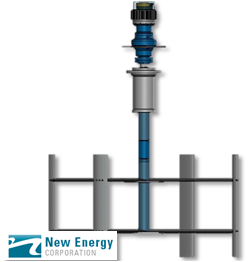
Finally, the vertical axis turbine from New Energy Corporation has been chosen to do our assessment due to the fact that its existing 25 kW turbine fits perfectly the requirements and its design has considered its installation on a floating platform or pontoon.
The 25 kW EnCurrent turbine is a vertical axis hydro turbine that generates electricity from the kinetic movement of the tidal stream. Four fixed hydrofoil blades of the turbine are connected to a shaft that drives a generator.
Its design is based on the Darrius wind turbine concept. The main difference is that the EnCurrent turbine employs straight blades as opposed to the characteristic eggbeater design of the Darrieus turbine. A series of aerodynamically shaped blades are mounted parallel to the vertical shaft in a concentric arrangement. The individual hydrofoils are connected via support arms to a central shaft which then transmits the torque to a generator or other power transfer device
(Ginter & Bear, 2009)
How it works
When a fluid stream flows past the turbine blades, lift is generated by a relative velocity vector composed of free stream and rotational velocity components. This vector forms an angle of attack with respect to the hydrofoil chord line, which oscillates from a peak positive value to a peak negative value once per revolution resulting in a maximum angle of attack twice per revolution.
The component of the lift force acting tangential to the rotor radius generates a net positive shaft torque regardless of the free stream direction of the flow. As the rotational speed of the turbine increases in relation to the water velocity an optimal angle of attack is reached where turbine performance peaks. This performance peak generally occurs with a tip speed ratio of between 2 and 3. Beyond this speed ratio performance degrades until a zero output freewheel state is reached.
The vertical hydrofoil blades employ a hydrodynamic lift principle that causes the turbine foils to move proportionately faster than the speed of the surrounding water. The cross-flow design is unidirectional, making power on both the ebb and the flow of the tide. The turbine is designed to work through the entire tidal range, beginning to generate electricity at a water velocity of 1 meter per second.
Variable Speed Operation
The turbine model chosen is able to work as variable speed. This is due to the fact that tidal stream velocity is continuously changing, so it makes difficult to operate the turbine at a constant speed and optimal operating point.
This is addressed by the system installing permanent magnet generator since the power electronics dominate the electrical system costs and the incremental generator cost is repaid through added efficiency. This variable speed system is better suited for supplement to a diesel generating system, as no extra control hardware is required since this is already provided by the power electronics system. It simply requires a small software adjustment.
References
Ginter, V. & Bear, C. (2009) "Development and Application of a Water Current Turbine". Canada: New Energy Corporation Inc.
Ginver, V. & Pieper, J. K. (2009) "Robust Gain Scheduled Control of a Hydrokinetic Turbine". Canada: New Energy Corporation Inc.
Matthews, S., Adams, J. & Vaply, B. (2012) "Marine Energy in the UK. State of the Industry Report 2012". renewableUK.com
-
Power Output
Power Available
The Power Available is the power that could be extracted from the resource for a turbine with a determined rotor cross section if the rotor efficiency would be 100%.

Power Curve
The power curve is calculated based on the technical data sheet of the tidal stream energy device.
Turbine relevant features used for calculating the power curve are:
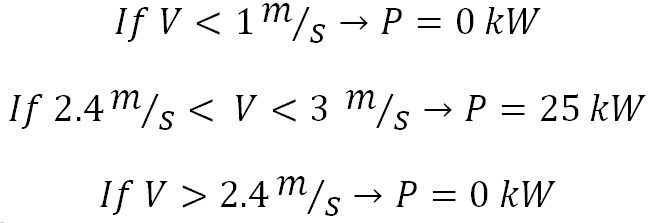
- Cut-in Velocity: 1m/s
- Rated Velocity: 2.4 m/s
- Cut-out Velocity: 3 m/s
- Rotor Diameter: 4.83 m
- Rotor Height: 2.41 m
- Rated Velocity: 2.4 m/s
- Maximum Power Output: 25 kW
- Number of blades: 4
The Power Output will be zero below the cut-in velocity and above the cut-out velocity, it will be equal to the rated power when stream velocity stays between the rated value and the cut-out one.
An approximation for calculating the Electric Power Output is:

Where:

For variable-pitch rotors, ηturbine can be assumed to be constant, but the other component efficiencies vary with percentage load (EPRI). The rotor efficiency is commonly considered to rise from 38% at cut-in speed to reach 45% at the rated velocity.
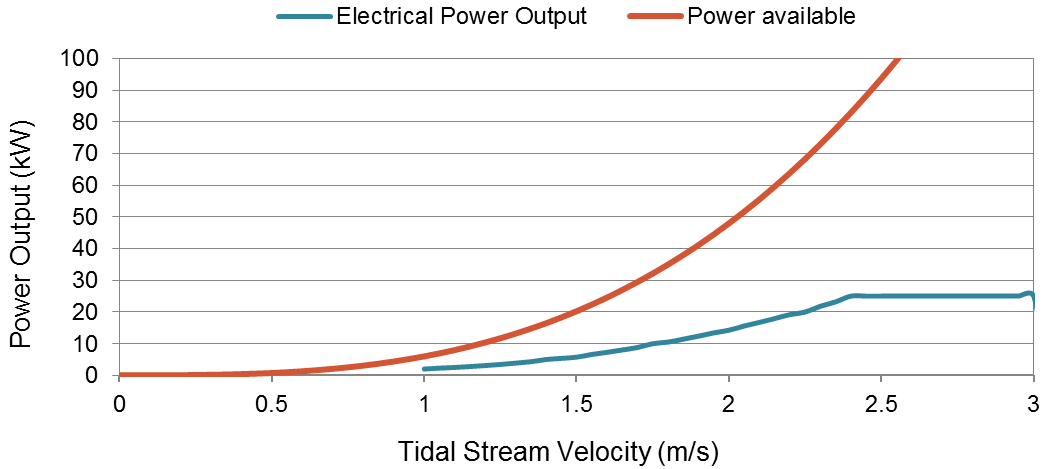
Below, the Turbine Electric Power Output Curve is represented, together with the Power Available on site
:
The next step is obtaining the Output Variation according to the Device Power Curve and the Tidal Stream Velocity Exceedance Curve for each velocity interval
:
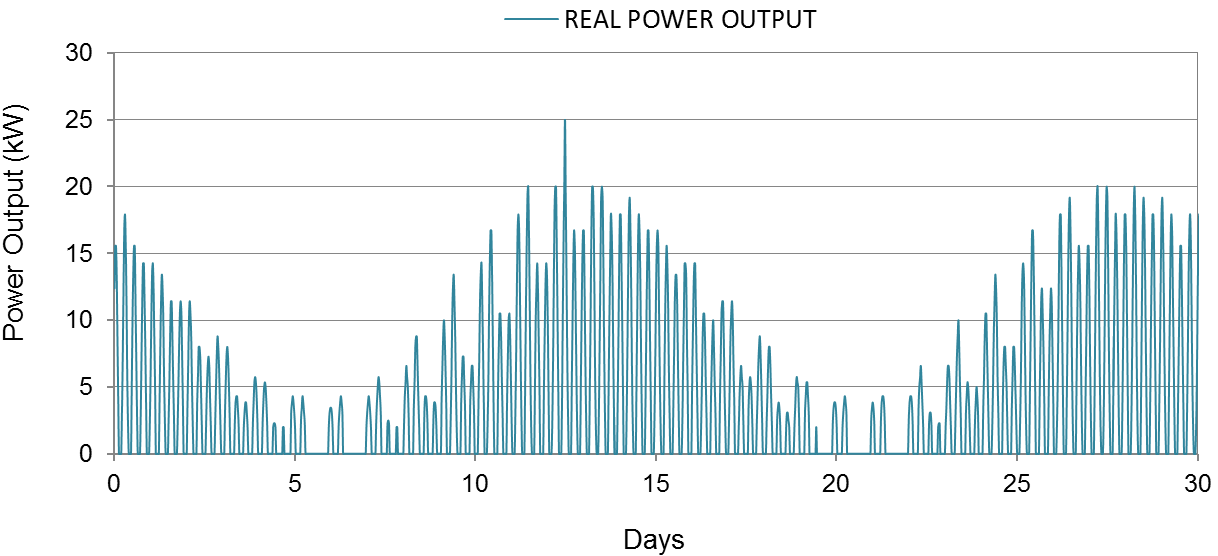
Annual Energy Output
Once the electric power output has been determined, the annual energy production is obtained by multiplying the average power output by 8,760 hours per year to obtain the maximum possible annual electrical energy production.
Nevertheless, in normal operation conditions, the turbine is subjected to routine inspection and maintenance, as well as forced outages for repair, which will reduce the percentage of time that the device is available to generate power. According to Hagerman, G. & Polagye, B. (2006), an availability of 95% is assumed.
Number of Tidal Stream Energy Devices
Considering the electricity imports in Findhorn Community and the environmental, social and physical constraints of the site, it has been considered to install 4 EnCurrent 25 kW tidal turbines. Therefore, the total Annual Energy Capture will be
:

References
Hagerman, G. and Polagye, B. (2006) “Methodology for Estimating Tidal Current Energy Resources and Power Production by Tidal In-Stream Energy Conversion (TISEC) Devices”. EPRI North American Tidal In Stream Power Feasibility Demonstration Project – Phase 1, June 14 2006
-
Project Outline
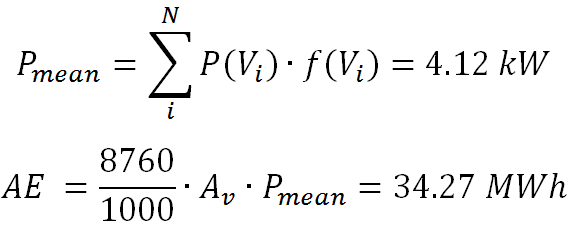
Project Configuration and curves of tidal height (blue) and power output (red) in an instant
The proposed solution is based on the installation of four tidal stream vertical axis floating turbines type "25 kW EnCurrent" or similar.
The turbine is mounted on a floating structure made up of two main torpedo-shape floaters to minimize the relative heavy movements. Nevertheless, the turbine could also be incorporated under the Marine pontoon, but the location 1(see Field Study) has been chosen instead due to its greater depth and stronger current during spring tide. Four flexible risers are proposed to hold each turbine.
The four turbines may generate an annual energy output of 137 MWh, where the turbines are supposed to be operative 95% of the time. Approximately 350 meters of seabed cable would be necessary to transport the energy to the shore.
Environmental Concerns
In all cases, the impact on the environment, fish and cetaceans and navigation must be considered. Findhorn and its surrounds are known by their natural beauty and its wildlife. It is highly noticeable that the Bay and its surrounds are designated as RAMSAR, SAC and SPA areas, so every human action which may affect its environment has to be deeply studied. In addition, some European protected species have found in Findhorn coastal area their suitable habitat. The most remarkable case is the Grey Seals community, which can often be seen hauled out on sand banks around the bay inlet. Moreover, River Findhorn is wide-known as an appreciated District Salmon Fishery, so the possible tidal stream energy generation impacts to the salmon have also to be considered.
The solution exposed in this project has been chosen by looking carefully to the environmental protection. The floating structure of the tidal stream turbine reduces the civil works and the affection on the seabed when operating. Also, the choice of placing the devices on the Location 1 (see Field Study) minimizes the interferences to navigation and leisure activities. And the most important, the turbine slow rotational speed and open design minimize the fish mortality rates. Finally, regarding the affection to grey seals and other mammals, it has been researched that these type of tidal turbines may not affect at all to these communities.
For further environmental statement, the following aspects have to be deeper studied:
- Impacts on cetaceans, pinnipeds and elasmobranches
- Impact on benthos
- Low Environmental Impact Technology and Deployment
- The physical/chemical characteristics of material arising from the installation of the turbine and the effects of their deposition
- Effects on water flows
- Effects on sediment transfer
- Impacts on marine flora and fauna in terms of scouring of the sea bed
- Potential for physical contact with fish, sea birds and mammals
- The visual impact of the turbine structure above the water
- The noise disturbance implications of the development
- And of course... it should be looked how to enhance the positive impacts!
References
Department of Energy and Climate Change (2010) "Severn Tidal Power: Feasibility Study Conclusions and Summary". Wales.
Freeman, S.M., Hakins, K.R, Kirby, A.d., McCall, R.A., Blyth-Skyrme, R.E. & Edhouse(2013) "Impacts on Fish and Shellfish Ecology. Wave & Tidal Consenting position Paper Series". Natural Environment Research Council: http://www.renewableuk.com
Sparling, C.E., Coram, A.J., McConnel, B., Thompson, D., Hawkins, K. R. & Northridge, S. P. (2013) "Marine Mammal Impacts. Wave & Tidal Consenting position Paper Series". Natural Environment Research Council: http://www.renewableuk.com