-
The electrical network system installed in Findhorn community is composed of the local electricity generation (wind generation), the electrical loads and a connection to the general grid. As the community is grid connected the loads are supplied by the general grid when the local wind generation is not high enough to supply all the demand, and the surplus of electricity is exported to the grid when the wind generation is higher than the demand. Therefore, the supply (local wind generation) is compared to the demand (communities’ electricity load) to determine the deficit (electricity imported from the grid) and the surplus (electricity exported to the grid).
To determine when the system is exporting or importing energy from the grid the local wind generation profile and the community demand profile are compared. This analysis is called Supply and Demand Match (SDM) analysis and its output is either a graph showing the power that is imported or exported from the grid during a period of time, or the total amount of the energy imported (deficit) and exported (surplus) from the grid during a period of time.
The deficit and surplus of the system can be modified in different ways: by modifying the demand, by modifying the generation and by installing and electricity storage system. In this project each of the modifications initially proposed have a particular effect on the system:
- Thermal system improvement: The reduction of the heating loads modifies the community demand profile.
- Tidal generation: The electricity generated by tidal resources increase the total generation of the community.
- Storage system: The electricity surplus is stored when the generation is higher than that the demand and released when there is deficit of electricity.
For this project, it has been presumed that the deal that the community has with the electricity supplier is that the electricity imported from the grid is bought at £0.14/kWh and the electricity exported to the grid is sold at £0.09/kWh pence.
Supply and Demand Match analysis Software
To carry out the SDM analysis, MERIT software has been used. MERIT is a dynamic demand and supply matching-design tool for renewable energy systems developed by the University of Strathclyde. The inputs that have to be configured in MERIT are:
- Climate data locations.
- Renewable generation systems.
- Demand profiles.
- Electrical storage systems.
The results of a SDM Analysis are the followings:
- Graphs of generation, demand and state of charge of the storage system.
- Total values of generation, demand, surplus and deficit.
- Climate data locations.
In the initial stage of the project, two others software have been suggested: RETScreen and Homer Energy. After analysing all the options, MERIT has been selected as the best software for this current project due to the availability of support provided by the University of Strathclyde.
Methodology
In this project, the SDM analysis has been used for 2 different aspects:
- Helping in the design of the technologies analysed.
- Analysing the effect of the modifications proposed.
First, in order to design the different technologies (heating improvements, tidal generation and electrical storage), those later have been configured in different sizes and simulations were carried out for each of the systems. By analysing the effects that the solutions proposed had on the community it was possible to determine if they had a significant impact on the total generation, total demand, surplus and deficit. In function of those results, the sizing of the system was adapted. This was an iterative process as sometimes, the results from MERIT were given design that were not feasible in reality, so another adequate size for the system needed to be find and analysed again.
When the size (for each technology) that have a significant impact on the performance of the community were determined, it was used to provide a more accurate design of the system and it was possible to choose the exact technology that was going to be used and all its components.
These final specific designs of the systems proposed were lastly analysed in MERIT software to see what effects these modifications had, compared to the initial case. In all cases, this second round of simulations have been carried out for the period of a year providing better results of the effect of the modifications.
-
Data from the current electrical system installed in Findhorn has been collected in order to define the Generation and Demand profiles. These data has been used to compare the initial scenario with the improvements proposed in this project and quantify their effect.
Generation
Regarding the generation, a 750kW wind farm, composed of 4 wind turbines, provides electricity to the Findhorn community. By defining in MERIT this wind turbine power output and by using the climate profiles provided by the program, it is possible to obtain the following generation profile:
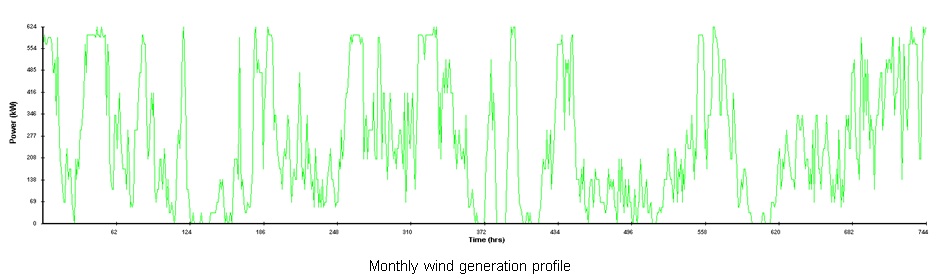
The data shown in the figure corresponds to the month of January. Obviously, the wind generation is varying every year and consequently it is not possible to estimate precisely the future generation. However, an annual analysis has been done and the annual wind generation was found to be 1.65GWh. This number has been compared with data from previous years provided by Findhorn community and it was observed as a correct value for an average annual wind generation.
In this analysis the energy generated with PV solar panels was neglected, as its power capacity is relatively low and the electricity that they generate is directly used in the buildings where they are installed.
Demand
To create the demand profiles It has been essential to have access to the demand data collected by the ORIGIN Project. This data shows the total electrical demand in the entire community every five minutes. A lot of data were collected from different period of time and from different meters. They were then analysed and compared in order to provide an accurate demand profile. This profile was then adapted for MERIT software and typical winter and summer weeks profiles are shown below:
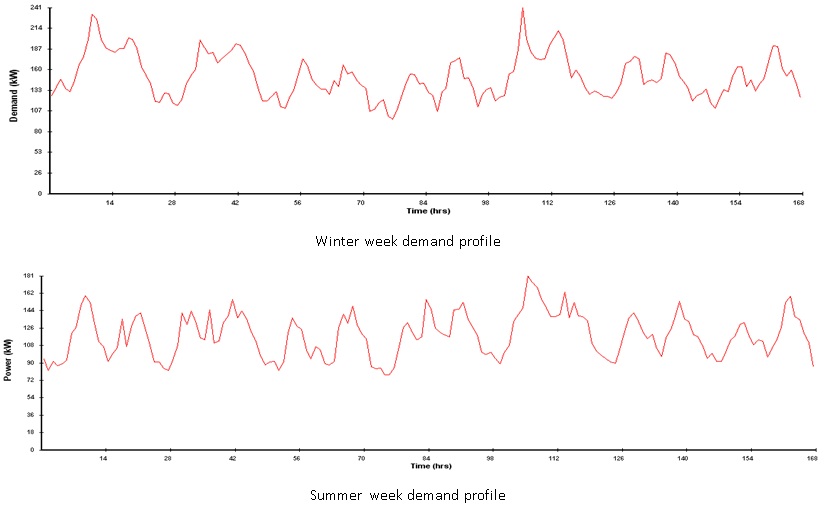
While during the winter, the maximum peak demand is 240 kW, it is reduced to 175 kW in the summer. It is also possible to see that the daily profile has similitudes: the peaks of demand occur in the morning and in the evening and at night the demand is lower. The total annual demand for the entire community has been calculated taking into account these demand profiles, and a value of 1.2GWh was found for the annual electrical demand.
Annual Analysis
The annual demand and supply match analysis of the initial scenario carried out has the following result:
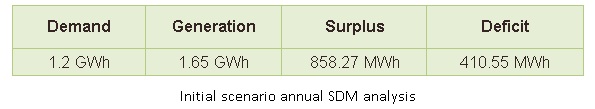
Although the total energy generated by the wind is higher than the total demand, there are some moments when the demand is higher than the generation, creating a deficit of energy in the system. In a similar way, when the generation is higher than the demand there is an electrical surplus.
As the community is connected to the general grid, the surplus is sold to the grid at £0.14/KWh; the deficit is supplied by the same grid and bought at £0.09/KWh. The results show that approximately half of the electricity generated by the wind turbines is directly used in the community and the other half is sold to the grid. On the other hand, two thirds of the demand is supplied by the energy generated in the community and one third is imported from the general grid.
-
Some modifications were proposed for the heating systems. To analyse their effect on the Supply and Demand Match, it has been considered that 10 dwellings of the community were adopting these improvements.
The system improvement consists in substituting an electrical heating system with a system composed by solar thermal panels, electric backup and a hot water storage tank. This system is the same as the system analysed in the thermal systems section.
The installation of solar thermal panels will have a reduction on the total electrical load of the dwellings. An approximate value of this reduction has been calculated taking into account the average heat generated from the solar thermal panels in a winter and a summer week. The value of the reduction has been calculated with the C# programme used in the heating systems analysis.
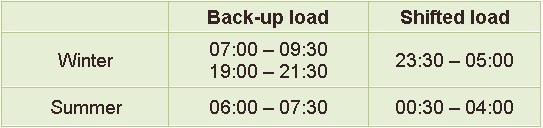
The storage tank capacity allows shifting the loads from peak hours to off-peak hours. The system proposed (solar thermal panels + electric back-up) has electrical demand when the heat generated by the thermal panels is not enough to supply the demand. By having a big storage tank, it is possible to shift the loads of the electric back-up and pre-charge the tank during the off-peak hours. Shifting the loads will create a more constant demand profile reducing the peaks of demand during the day and increasing the demand during the night. The table below shows the usual hours when the electric backup is used and the proposed shifted configuration:
The changes proposed in the heating system of 10 dwellings have a significant impact on the demand of the entire community that can be analysed in the graphs shown below:
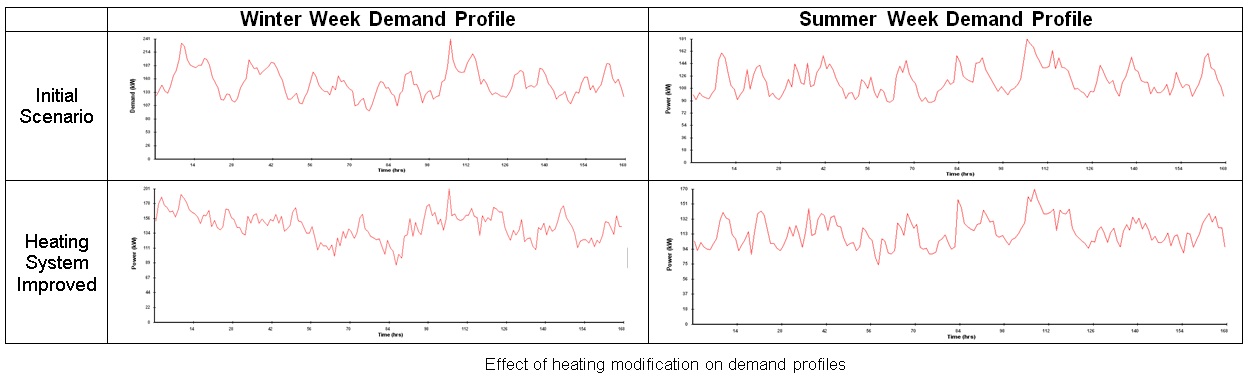
As it can be seen in the above figures, the electrical demand of the entire community is largely modified during the winter. Actually, during this period, there is a higher heating demand, due to low external temperatures and as there are low gains from the sun, the overall electric demand for heating is increased. With the improvement, it is possible to see that the demand profile is more constant and the peaks are reduced, as some of the electrical heating loads are shifted from peak hours to off-peak hours. During the summer, the effect that can be observed in the graphs is fairly lower. However, the total electrical demand reduction during the summer is significant as the heat generated by the thermal panels is higher.
Annual Analysis
An Annual Supply and Demand Match analysis has been carried out in order to see the effect that the modified demand profiles has:
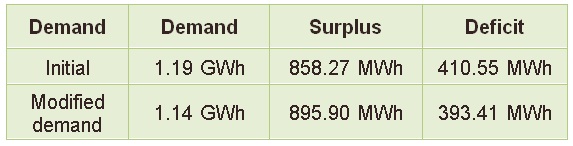
On one side, it can be seen that the overall reduction of demand is 50MWh per year. This can be considered as an important reduction taking into account that the modification on the heating system has only been applied to 10 dwellings of the community. Therefore, the reduction of electrical demand per dwelling is 5MWh/dwelling.
On the other hand, it is possible to see that this modification has not an important impact on the deficit as it is reduced by just 17MWh/year. In this case, the electric loads have been shifted from peak hours to off-peak hours, resulting in a more constant demand. However, to reduce the deficit the demand has to be reduced when there is no wind generation and the community is importing the energy from the grid. As the wind generation is unpredictable it is not possible to reduce the deficit by just shifting the electrical load from peak hours to off peak hours. For this reason, a further future improvement has been identified in this part of the project and is proposed as a future work:
- To develop a control system to charge the hot water storage tanks when there is surplus of electricity generated by the wind, and use it when there is deficit of electricity.
-
Tidal Generation
According to the tidal system proposed in this project, a generation profile having a peak power of 110kW can be configured and import in MERIT. The graph below shows the tidal generation and the demand profile for a winter month. It can be observed that the generation is always lower than the demand.
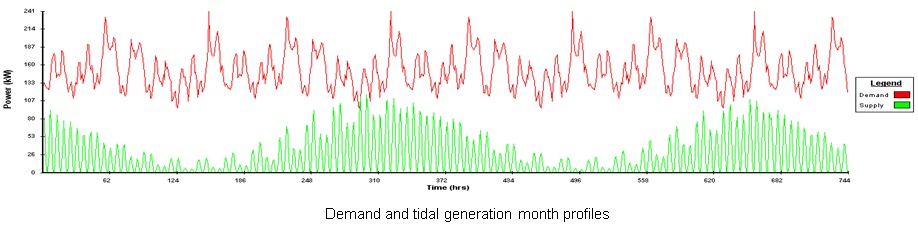
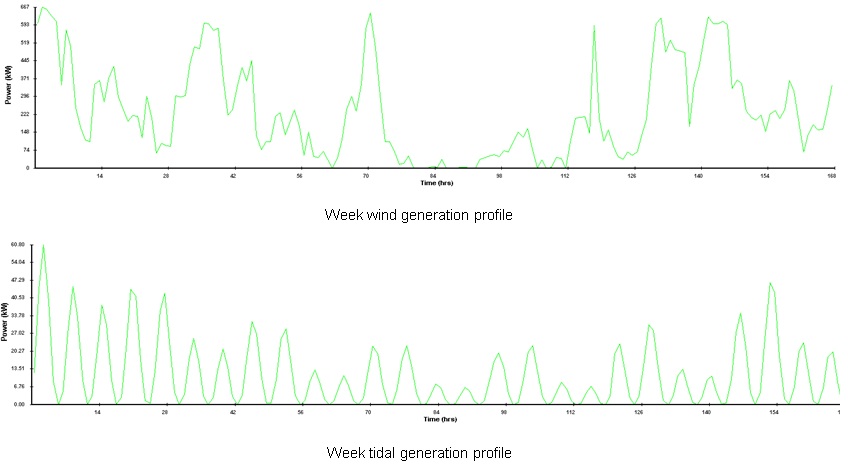
Although the energy created by the tidal generation is lower than the demand, it will reduce the deficit of the community. Actually, by comparing the wind and tidal generation week profiles it is possible to see that in some occasions there is none or very low wind but there is tidal. Therefore, the overall tidal + wind on-site generation can provide electricity to the community at additional time, compared to just with wind.
Annual Analysis
In order to see the performances of the system when the tidal generation system proposed is included, an annual analysis has been carried out:
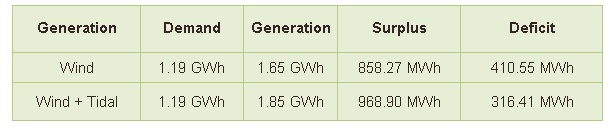
The total generation of the tidal system proposed in one year is 200MWh. This generation is much lower than the electricity generated by the wind. However, as the tidal and wind generation are completely independent, the tidal generation can supply the demand when there is no wind. By analysing the deficit, it is possible to see that is it reduced almost 100MWh in one year. This can be seen as a good system, considering that about 50% of the electricity generated by the tidal is used directly in the community.
-
One of the measures analysed to improve the energy system of Findhorn is to install an electrical energy storage system. As it is explained in the electrical energy storage section, the technology proposed is a Compressed Air Energy Storage system (CAES).
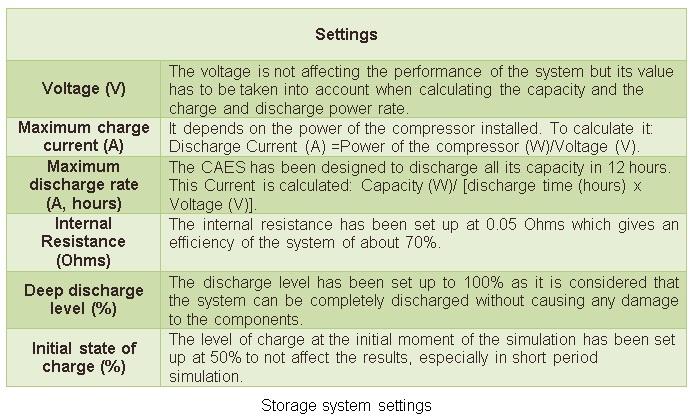
Modelling the storage system in MERIT
The storage system available in Merit is designed for an electrical storage technology like batteries and not for a CAES system. Therefore, some assumptions have been made to adapt the electrical storage system and have similar performances as the one provided by the CAES.
Sizing the CAES
To decide the appropriate size of the storage system the performances of different sizes of systems have been analysed. Two values have been changed to carry out the simulations:
- The total capacity of the system: defined in kWh, it expresses the amount of energy that can be stored in the CAES.
- The maximum charge power: it depends on the capacity (kW) of the compressor installed and affects the maximum amount of electrical surplus that can be used to charge the storage system.
• Week analysis
With the week simulations it is possible to analyse the effect that the storage system has on the surplus and deficit of the system, and the evolution of the state of charge of the storage system:
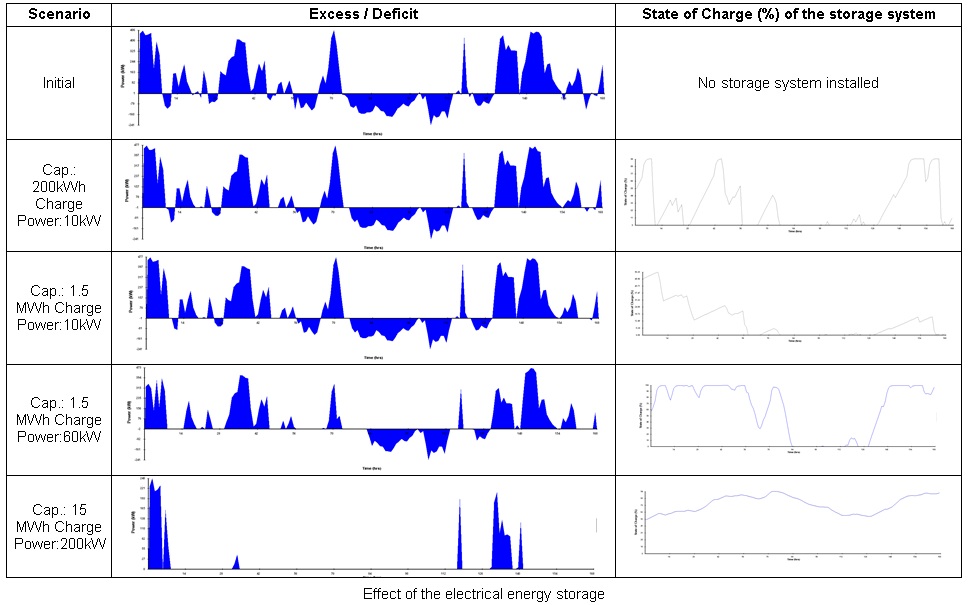
According to the results obtained it is possible to conclude that with a capacity of 200 kWh and a charge power of 10 kW, the excess and deficit of the system are not significantly modified. Increasing the capacity of the system to 1.5 MWh, the excess and the deficit are not reduced either. By analysing the state of charge of the storage system, it is possible to see that the system is not fully charged at any moment. This is caused by a small charge capacity that does not allow the system to be charged fast enough.
When the charge power is increased to 60 kW, it is possible to see that the excess and deficit are significantly reduced and the battery is fully charged at some moments and completely discharged at some others. Therefore, this can be considered as a system with a good performance. In the last simulation there are analysed the performances of a system with 15 MWh capacity and 200kW charge power. Obviously, this system has a better performance, reducing the deficit to zero and maintaining the level of charge always above 50%. However, this system has not been considered as a feasible solution for a small scale CAES in the design stage.
• Annual analysis
To analyse in more detail the effect of the CAES on the system an annual analysis has been carried out. For this analysis, the capacity has been set at 900kWh and at 1.5MWh and the charge power has been considered from 60 to 120kW. No other sizes of storage systems are considered here, as I was seen earlier that smaller storage systems do not have a significant impact on the performances of the system and bigger systems are not technical feasible.
Surplus and deficit results for different storage systems:
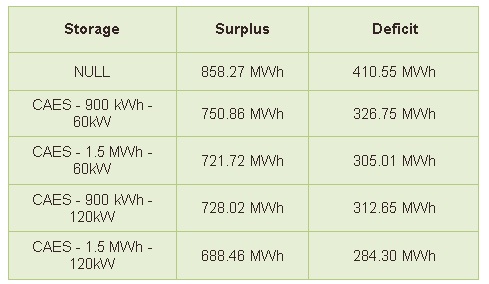
By increasing the capacity and the charge power it is possible to reduce the excess and the deficit of the system. With the systems simulated, the initial deficit of 410 MWh can be reduced to 327MWh with the smaller system (900kWh; 60kW) and up to 284 MWh with the larger one (1.5 MWh; 120kWh). From the study of CAES system, it was seen that 1.5MWh systems were achievable. It was then decided to choose this capacity as they offer higher deficit reduction. Moreover, from the above table, it is seen that the deficit reduction from the 1.5MWh-60kW system to the 1.5MWh-120kW one was only 20MWh per annum. However increasing the power of compression from 60kW to 120kW will require a bigger and more costly compressor. Hence, it was thought that installing the 120kW system instead of the 60kW one will lead to a low annual cost reduction compared to the cost of increasing the power of the compressor from 60kW to 120kW.
Therefore the CAES system chosen was the one having a capacity of 1.5MWh and a charge power of 60kW.