Biomass Installation Feasibility Tool

Model Details:
For the sensitivity study the model used was a 2 floor building with each floor occupying 1600 m2 of floor area. The building is located at east Scotland and the following load profile and energy demand was generated:
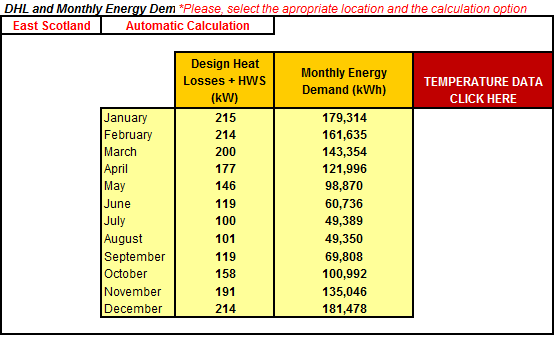
The aim of this sensitivity study is to observe the impact of the variation of the moisture content and calorific value over the fuel consumption, silo sizing and overall cost of the biomass system. The boiler for this system was sized as a 200kW boiler with 80% efficiency.
During the process of construction of the tool, more specifically at the wood fuel calculator, it was decided to work with two default set of values, one for the softwood and one for hardwood. Softwood is a generic term for wood from conifers trees and hard wood designates wood from broad-leaved trees.
It is important to observe how this generalization will affect the final result.
The picture bellow, from Phyllis database http://www.ecn.nl/phyllis/ shows the range of calorific value for softwood.
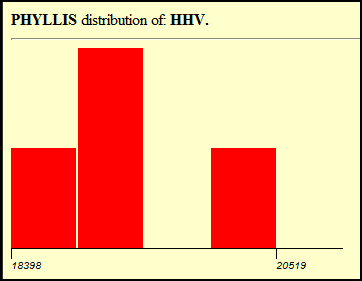
Observing that softwoods may be found with calorific value between 18 and 20 MJ/kg, a sensitivity study was made and observed that in the worst case, the chosen default value for softwood will drive to a difference of 7% of the final annual cost of the fuel (compared with the worst case, a softwood of 20 MJ/kg). The default value, 18.5 was chosen given the amount of trees close to that value.
For hard wood, the distribution is the following:
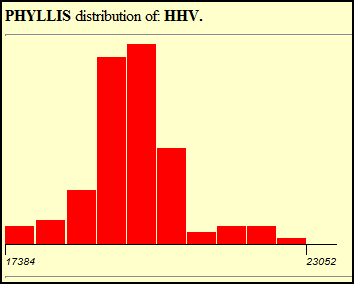
Once again, looking for the worst case scenario, the difference over the final result is 13% when compared the default value and a calorific value of 23 MJ/kg. At this case, the storage size may be also slightly affected. In the case studied, it added one day over the storage capacity at winter. Although the numbers are higher then the ones found with softwood, the amount of hardwood trees that will have such high calorific value is too small, not justifying moving the default value up.
Another interesting analysis may be the impact of the moisture content ranges, defined by the CEN specifications, over the final result of the biomass system. We will be looking for woodchips, since the difference of moisture between one categories and the next one is higher then with wood pellets.
As seen here, the variation of the calorific value given the moisture content is linear, resulting in a linear variation over the final cost of the energy. The sensitivity study observed that the worst case scenario, where the real moisture content of the fuel is at the limit of the category(a M30 fuel may have any moisture content between 20.1 and 30%), leads for a difference of 13% over the calculated annual cost of the fuel. Although this value may be reduced placing the moisture content at the middle of the category range, it was decided to work with the most conservative value.
This information can be also used to show that a lower quality fuel may indicate an extra 13% annual cost when compared with a good quality one, even if both are inside the same category.