Shading
Whenever people want to exploit sun’s energy, they have to face the issue of shadow. Sometimes the shadow plays a vital role i.e. solar clocks, sun protection tools etc. In our project shadow becomes an unwanted guest and we are trying to determine how significant its presence affects the power output. Our main goal in this section would be to analyse whether the space between wind turbines could be effectively accommodated by solar PV panels.
Assumptions
There isn’t an overall way to determine available PV area for all the wind farms, due to diversity of turbines allocations, different size of turbines or different geographical location. Therefore we assumed relatively bad scenario with the closest possible spacing of an average wind farm in the UK (~12 MW) represented by six 2 MW wind urbines. The climate that we chose for the simulations was Glasgow climate. It was chosen due to availability of the data from the software and relatively close location to the one of the area we investigated further on in the other section, which is Oban.
Regarding PV panels, an array of 84.2 m2 was a base model, that covered 51 Solar polycrystalline panels 245W each. The system was designed with 17 11kW inverters.
Back to top
Model description
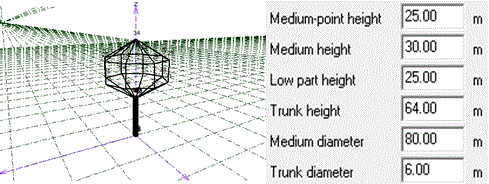
Simulations were performed in PVsyst. The software is basically made to deal with solar energy and doesn’t have any default models of wind turbines. Therefore to actually give a decent approximation the following model was chosen.

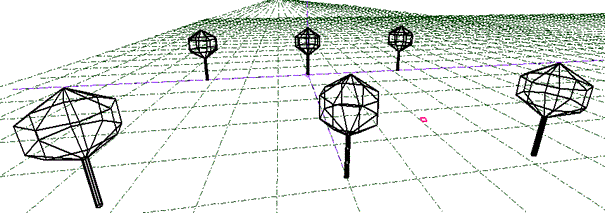
Presented model is quite conservative view on a wind turbine’s shadow simulation, nevertheless Pv syst doesn’t support any moveable objects in the simulation therefore after consultation with our industrial supervisor given model was assumed. The dimensions were based on the dimensions of 2 MW wind Turbine.The picture beneath presents the model used for simulations. The relatively small pink rectangle that can be spotted between middle and eastern turbines is the assumed model of a PV panel that was moved around the area between these turbines.

The panel was moved from a starting point (10m south from the middle northern turbine and 0 m in the eastern direction) to a variety of 384 locations within the square bordered by four of the six turbines (2 middle and 2 eastern). The panel has been moved every 20m south (from 10m to 470m) for each 20m in the eastern direction (from 0m to 300m). The next step after the simulation results were obtained was to actually weight which losses are significant and which are not. In order to determine that we assumed a scenario that area used for the wind farm belongs to developer. Therefore if developer had to lease the land somewhere nearby the wind farm he/she would have to pay 4,500 GBP/MWp of solar panels. In a scenario that losses due to shading over a year would cost less per GBP/MWp for a given spot, developer could consider installing PV panels on his own area without any additional costs. We assumed the cost of solar energy exported to be as actual feed in tariff which is 6.16 p/kWh. The model used for simulations has 12,5 kWp which based on simple calculations gives a price of 56,25 GBP for leasing a land for such array.
Back to top
Results
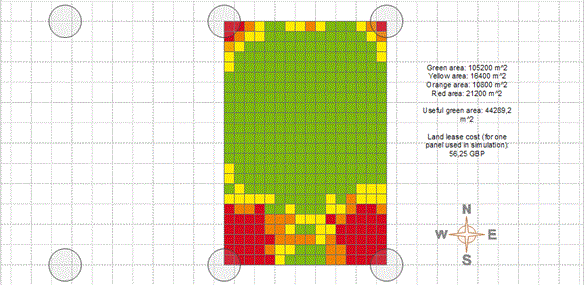
The results of performed simulations were surprisingly positive compared to what was expected. Vast area appeared to be more effective than a land lease. The picture below presents a graphic output of the results.


Obviously the longest shades occur during months when solar panels are not really producing a lot of power. The reason why the red area is focused northern from the turbines is because that area is partially shaded during the summer months, when power production from PV is on its peak. Northern shadow for summer months was between 100-140m length, which is reflected at the picture.
Back to top
Conclusion
Despite our first thoughts, the software has shown that placing PV panels between the turbines is not a bad idea after all, even while considering quite tough scenario. Obviously a lot of things depend on circumstances, area ownership, turbine’s spacing etc. The investment would need to consider also a risk associated with variable land lease cost. Shading analysis should be done separately for different location and configuration of the wind system. Our purpose was to check whether it can be feasible or not, and to show the methodology how can it be done and simplified. To finally conclude it has to be said that shading is not the issue that stays against feasibility of PV and Wind parks, although there are few previously mentioned circumstances that have to be satisfied in order to effectively share the area.
