
Finance
As we examine the potentials of establishing a solar farm to an existing wind farm in order to maximize the output of the combination of those two, it is necessary to ensure that the developer, who will invests to the new solar farm, will gain the desirable return. This financial analysis occurs only for the solar farm and not for the combination of the two power generations (Solar & Wind).
The analysis is consisted of:
“The aim of this analysis is to demonstrate the actual value of the project and identify the major factors that influence the whole investment. “
Back to top
Description of the Model
For the needs of our project a spreadsheet model was developed. The inputs of the model are divided into static and dynamic.
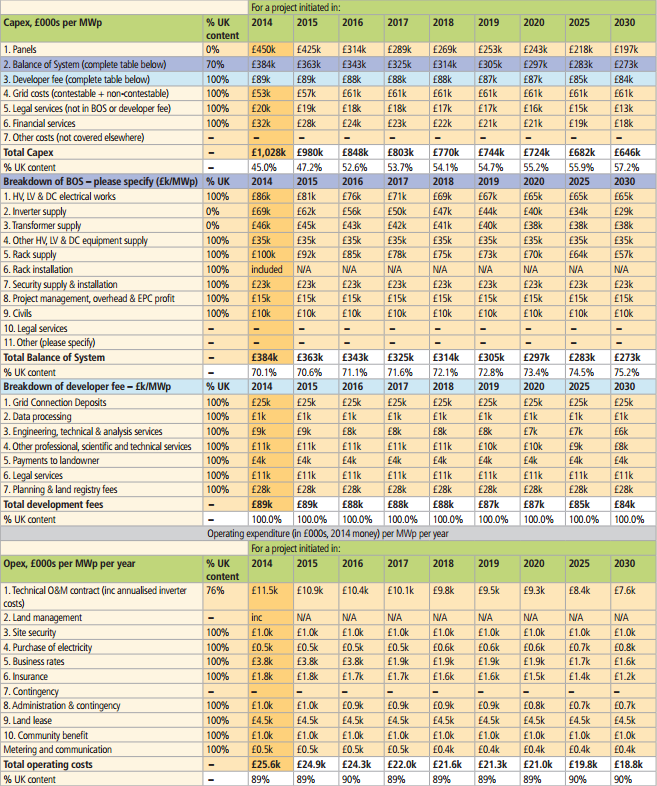
The static inputs are the CAPEX and OPEX, of the solar farm (£000s/MWp), which were provided by the Solar Trade Association for the existing and predicted costs of the solar market.
The dynamic inputs are consisted from:
The next part of the model is the project annual cash flow analysis, which illustrates the project economics during the operational lifetime of the solar farm. This is the part of the tool where the developer of the solar farm can extract information about the course of the investment.
This tool was developed in order to evaluate the different cases which could be established for the desired location. Apart from the description of the basic elements of the model, it is worth mentioning that while stakeholders may desire to know more about other important aspects of the project (e.g. balance between equity and debt) this model focuses on IRR and simulates the investment as a function of two variables, the value (money) which is invested and the value that is returned at the end of the project’s lifetime.
Concluding reference must be made to the agents that are out of the influential sphere of the existing information and data that were utilised for the development of the model, such as, the level of influence of the costs of the technology to the levels of subsidy. These kinds of factors are not included and not taken into consideration on the whole financial analysis of the project.
Back to top
Sensitivity Analysis
Being biased that the annual energy yields which solar farms could possibly produce in Hemsby, are going to be inadequate, there were efforts of picking best cases scenarios in order to achieve a clear approach to the real case scenario. If the results from these scenarios were to be benefiting the project at irrational levels, then more realistic cases would be picked. Four different scenarios were chosen in order to demonstrate the financial feasibility of the solar farm project. In order to be able to compare the different scenarios, in each case the same changes were applied.
The changes are:
- Default Project no changes, very optimistic strike price levels
- Excluding the grid connection and the land lease costs
- The cost of panels and inverters is halved
- Apply a more realistic strike price
In order to investigate the influence on the IRR, the sensitivity analysis was divided into two parts. The aim of the first part is, to examine which is the real value of the project after individual step and the value at the end when all together are applied. The aim of the second part is to investigate which of these, individually, influences the most the IRR.
Part A
By stressing these factors in that series their influence on the IRR is reflecting the value of the investment. When all these steps are applied, with the exact row, then the IRR reflects the value of the project in reality. Throughout this part of the analysis, stakeholders can identify when the investment is profitable and when it is not. The next images demonstrate that clearly.
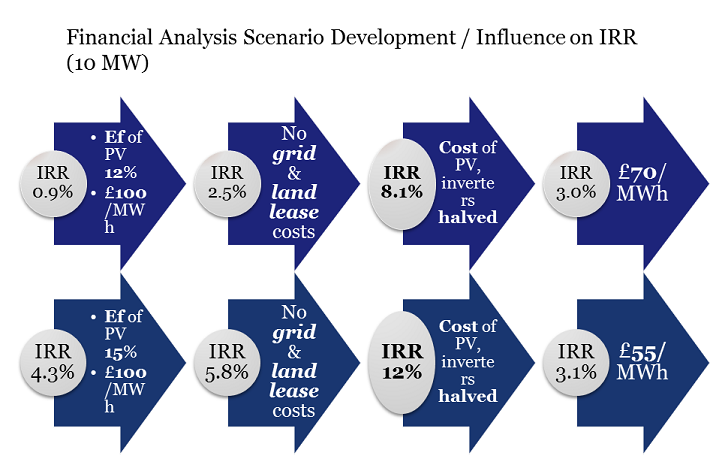
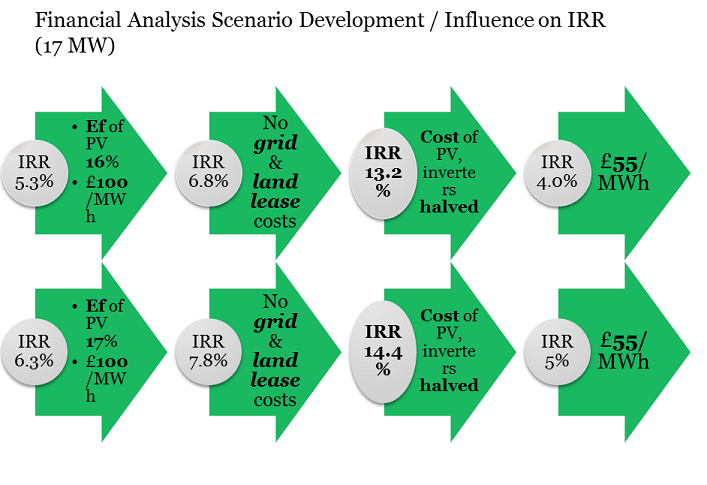
Regarding the first two different cases, the capacity is 10 MW and they share PV panel efficiencies of 12% and 15% respectively. Regarding the last two the capacity is 17 MW and the PV panel efficiencies are raised to 16% and 17%, reflecting the claims of various PV panel developers for improved technologies.
By examining the IRRs, it is obvious that all solar farms are picking in the third step when the costs are halved. Especially the last three are exceeding the desirable levels of IRR (10%) and render the investment valuable. However, when applying a more realistic subsidy (£55/MWh) it is clear that there is a great loss. This reflects the impact of the recent electricity market reform to the solar industry which troubles many developers in reality.
Part B
The purpose of this part of the analysis aims to find the possible opportunities which could drive the investment into gaining value, which is to say for example if the raised efficiency of the panels is the solution that offers the greater positive impact on the IRR.
By retrospect to the findings of the Part A of the analysis, it is obvious that the IRR is less sensitive to the grid connection and land lease costs, and more sensitive to the strike price, he efficiency of the panels and last but not least to the halved costs of the technology. Thus Part B was focused on the last three factors.
Yet again in order to get a clear approach to the impacts on the value of the investment, the IRR was examined only by altering one factor at the time.
In order to examine the influence of the level of strike price to the IRR the case of the 17MW capacity solar farm was chosen. The cost of the technology is not halved. The efficiency of the panels is 17% and the costs of the grid connection and land lease are zero (best case scenario).
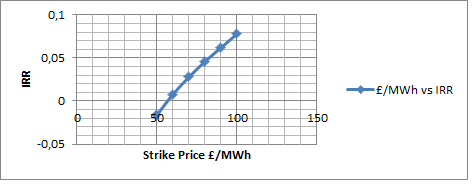
It is clear that with the recent CAPEX prices the investment is not viable; even if the subsidy is equal to £100/MWh the IRR does not reach the desirable 10%. From the other hand the subsidy is influencing the project dramatically. Once again the importance of subsidy in terms of supporting new projects in renewable generation is unveiled
Moving on the impact of the efficiency to the IRR, the strike price is £100/MWh, no grid connection and land lease cost are taken into consideration and the capacity is again 17 MW. Also, the cost of the technology is not halved. The efficiency ranges from 12% to 17% in order to represent the existing technology and the most, reasonably,improved.
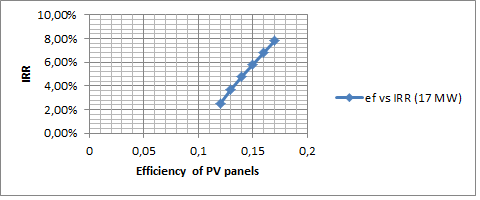
The outcome of the graph is that the efficiency does actually affect the IRR but cannot render the investment viable. A similar influence to the strike price is observed. Apparently, there is space for improving the technology and adding value to the project but simultaneously the cost of the technology must be reduced.
The last factor is the halved costs of the panels and inverters. The capacity is 17 MW, the subsidy is £100/MWh and the efficiency ranges from 12% to 17%. Once again no land lease and grid connection costs are taken into consideration.


Comparing this factor with the other two, it is the only one who doubles the IRR. However as mentioned before the stakeholders must evaluate the changes in subsidy when the costs are going to drop.
Back to top
Conclusion & Discussion
After all the analysis, it is clear that the results are far from the possible developer's interest. Obviously the IRR is low due to the high CAPEX and the low levels of subsidy. Also the actual efficiency of the PV panels must be calculated because A factor that could compensate the OPEX is the revenue that comes from the annual energy yield.However UK is not a suitable location thus the revenue is not only up to the energy that is exported from the Panels.