Methodology for a Decision Support Tool for a Tidal Stream Device
MSc Sustainable Engineering: Offshore Renewable Energy


Wave/Tidal Interaction Tool
The tool “Wave/Tidal interaction” is software which was designed to find the maximum diameter of a tidal stream turbine and where the hub should be located. The tool introduces an allowable percentage variance of flow velocity over the span of the rotor which is dependent on site depth, tidal data, and wave effects. The aim of the tool is to eliminate sites which will be impractical at an early stage and thus reduce wasted time, energy, and resources carrying out detailed design. Using the outputs from this tool a more detailed analysis can be carried out on the site and the type of turbine(s) which could be used.
Download: Wave Tidal Interaction Tool
Inputs
The inputs for the Wave/Tidal Interaction tool include the following:
• Tidal velocity at the surface (An optional scaling factor can be added)
• Depth of water
• Wave characteristic expected (Hs)
• Percentage of velocity change
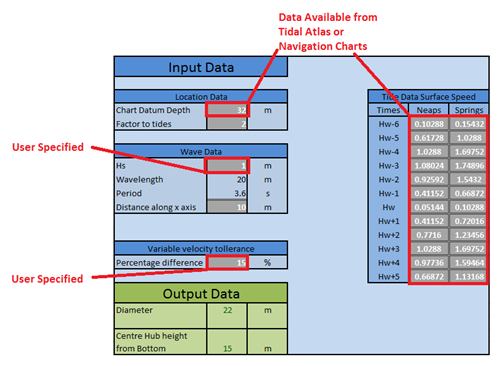
Wave/Tidal Interaction tool inputs
Outputs
The tool should be used to determine if the location has the correct velocity characteristics for operation of the turbine. The velocity profile should be as similar as possible over the span of the rotor. A good estimation of the variation is around + or – 5%. This variation can be changed as an input so that a device which is highly sensitive to variations can be incorporated. Having determined the velocity characteristics the tool then calculates the centre hub height and diameter of the tool using the section of water where the velocity profile is most consistent. The diameter is used in a blade element momentum analysis to determine the annual power generation.
With this in mind, the Wave/Tidal Interaction provides the following outputs:
• Diameter of tidal stream device
• Centre of hub height from sea bed
MS Excel is used to generate graphs to show the particle velocity dependant on depth and tables to illustrate the position of the blade with respect to depth in a clear way.
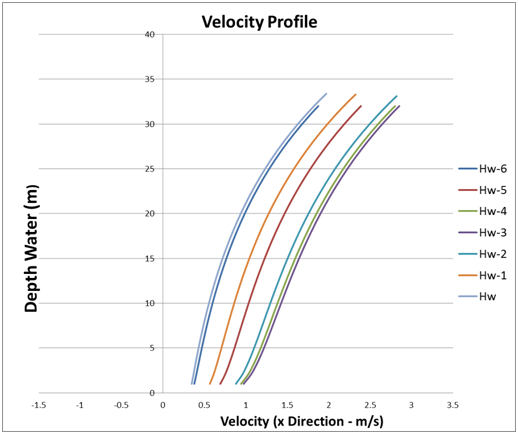
Particle velocity dependant on depth
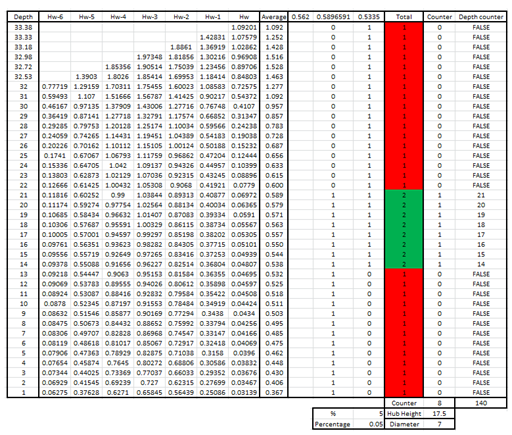
Position of the blade with respect to depth in a clear way
Methodology
The process starts with an input of tidal stream surface data. To find the velocity over the depth a 7th power curve is created to match the surface speed. This then creates a velocity profile which decreases with depth. A factor can be multiplied to the surface speed to allow the sensitivity analysis to be carried out.
The wave particle velocity accounts for the cyclic motions of particles under a wave. (Assuming linear wave theory) Good reference site:
Since the particles depend upon the relative position of the wave, a distance along the x axis is added which allows the particles to move in their cyclic motions around the stationary device. This x distance can be altered at the input stage but sensitivity analysis suggests that the worst case scenarios will occur when the crest of the wave is directly above the turbine.
The wave drift force is calculated as the net movement in the wave. This is carried out using the wave characteristics. The wave drift force, wave particle velocity and tidal stream all depend on depth and are summed together to create a total velocity profile. This profile is then used to determine the blade diameter and hub height.
The position and size section of the turbine is found using an average of the total velocities over the 6 hour period between low water and high water (Flood tide). The programme is set up to not allow the rotor into the bottom 1/8th of depth as scouring may occur. The top limitation is set at 5m below the lowest astronomical tide (charted depth). This allows a set range in which the rotor is able to be situated to be calculated. The maximum diameter is first found using the average value of the region which is available to be used. Adding a percentage variation and then applying the MS Excel “IF” function multiple times finds the region which suits best. Sensitivity can be carried out by changing the percentage variance.
Assumptions
• One wave passes the turbine (regular, linear waves)
• 7th Power law to describe the bottom shear profile
• Max wave height = 1.86xHs (Significant wave height)
• Wavelength = 1/20 of the max wave height
• Period = Sqrt (Wavelength / 1.56)
The wave period, maximum wave height, wavelength and period can be entered manually but to simplify, the values are all calculated automatically using the assumptions above from the significant wave height (Hs) value. The use of the Hs value is due to its relative accessibility on the internet and literature for large areas of the country. Data is available in the references.
References:
➙ [22] Andy Saulter, A. L.-W. Assessment of Significant wave height in UK coastal waters - 2011 Update. Retrieved
March 2014.