Methodology for a Decision Support Tool for a Tidal Stream Device
MSc Sustainable Engineering: Offshore Renewable Energy


Exceedance Curve Calculation
The tidal exceedance tool is used to generate a probability function of the tidal flow rates. The tool uses the tidal data found from the tidal interaction calculations (this can be viewed in the wave/tidal interaction tool tab) at the height of the rotor hub to calculate the probability of a tidal flow speed occurring. The output graph shows the number of days in a year when the tidal speed will exceed speed values. This is important for tidal device analysis as it can be used to estimate the power output of the device.
Tidal data inputs come from admiralty charts and navigation handbooks rather than data sampling from the site. This is because the tool is designed to give a quick return on results rather than use a lengthy and expensive process to find real site data. Although the tool can be used with any collected site data the user may be able to access.
Download: Exceedance Curve Calculator
Inputs
The Main inputs for this program are found from either the marine navigation almanac or from the wave/tidal interaction tool to predict rotor size and height characteristics. This are:
• Springs and Neaps tidal speeds in m/s from tidal almanac
• Water depth of proposed site taken from admiralty charts
• Height of the rotor hub from the seabed found from the wave/tidal interaction tool
• Power law used in the wave/tidal interaction tool to predict the reduction in flow speed at the rotor depth due to tidal
shear.
• An extra input allows the user to insert the name of the site that is being analysed.
As this is an excel tool it is straightforward to use. Once the correct inputs are updated in the inputs field, then the program will update the results to show a new Exceedance curve and set of probability data. This data can then be exported into another program or compared to a set of different proposed sites.
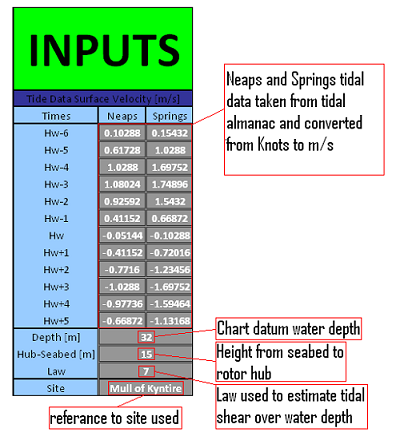
Data input interface
Outputs
The two outputs from this tool are the Exceedance curve and the Flow Probabilities. The Exceedance Curve shows the days per year the speed of the tide exceeds a certain values. This is important because the speed of the tide changes with every hour, so the power output will be non linear. If this data is known it will be possible to estimate how the power characteristics will vary and power conditioning can be introduced. The second output is a table of Probabilities and these can be exported into the Blade Element Momentum program that as they can be used directly to calculate an estimate mechanical power output.
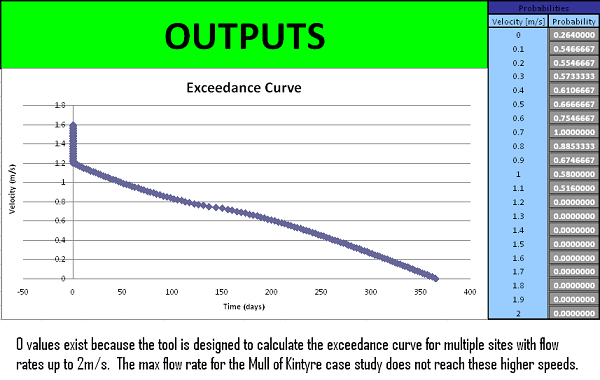
Data output interface
Methodology
The original data is processed through six steps to calculate the final exceedance curve:
Step 1 – Altering the tidal data for central hub height
Firstly the data extracted from the tidal almanac (sampling period of 1 hour) is converted from knots to m/s. These values are then altered using the 7th power law to find an approximation of the flow speed at the central hub height (hub height, law and tidal data are all inputs).
Step 2 – Altering the curve to fit a sinusoidal function
The graph that can be plotted from the neaps to springs data needs to be changed into a more useable function. This is done by using a sinusoidal curve fitted to the maximum tidal values for each change in the state of the tide. 12 values of tide are each allocated to 30° increasing intervals of the sinusoidal graph.
Step 3 – Increasing the precision
It is necessary to increase the precision of the data that is extracted from the tidal almanac. This is done by interpolating an extra 100 points between the 12 “real” points. This means that instead of having 12 values of tidal speed for neaps and 12 for springs we have 1200 for each.
Step 4 – Forming the probability matrix
Firstly a 1200 by 100 Matrix is formed by distributing 1200 values of tidal speed of neaps and springs against 100 values that are found in the difference between neaps and springs at the same state of the tide (ie + or – a number of hours) this is done by extrapolation using a sinusoidal function as the sinusoidal curve allows for the altering rate of change between neap and spring tides.
Step 5 – Counting the values
The next step involves counting values in the matrix. A set of tidal speed values are listed and the program will then count how many times that that value appears in the matrix. These values can be used to create a distribution pattern.
Step 6 – Converting probabilities into an Exceedance curve
Lastly, using the probabilities found by dividing the number of times a certain speed occurs by the total of the 1200 by 100 matrix the probabilities are calculated. These probabilities are then summed for increasing values of speed and multiplied by 365 to gain data that show how many days per year the tidal speed will exceed the values.