HOME ENTERTAINMENT EQUIPMENT MEASUREMENTS
Home entertainment equipment selection | Power consumption |
Case temperature profiles | Fan temperature profilesThe main objective of all the measurements detailed below was obtaining reliable data of home entertainment equipment heat emission for later simulations.
Home entertainment equipment selection
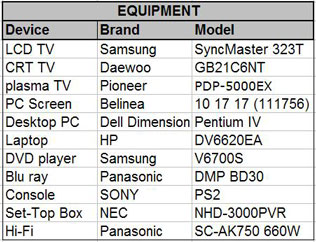
The devices selected for this study are representative models of home entertainment equipment that could be found in any UK home for the three situations under study (current, future and rational).The list of home entertainment equipment used and their features are shown in the following table:
Table 1. Equipment usedAll the devices considered were split up into three different categories, according to their shape, which will mainly rule their heat emission profile:
- Flat shape: LCD TV, Plasma TV, PC flat Screen
- Cuboid shape: Play Station 2, DVD player, Blu ray, Set top box, Hi-Fi
- Singular shape: Laptop and AC adaptor. (Independently measured due to their specific shape, not similar to any other devices)
Two different types of measurements were carried out:
1. Power consumption
2. Temperature profilesPower consumption
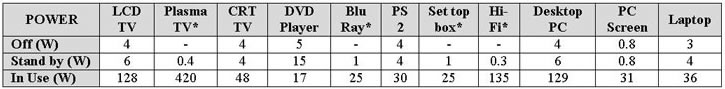
The procedure consisted in measuring electrical consumption from every device in three different situations:
- Off Power: When the device is turned off and plugged into the electrical network.
- Standby: When the device is on standby mode.
- In use: When the device is turned on.
The measurement equipment used was a Plug-in power monitor (Model 2000 MU-UK) with an Active Power accuracy of Max: 2% and Typ: 0.5%
In the following table they can be seen the whole electrical measures from the devices selected:
Table 2. Electrical measures
*For the devices not available to us, data was taken from specifications and user manuals.Case temperature profiles
When measuring the temperature profile of the devices, home entertainment equipment was broken down into three different groups according to its availability:
- Reference devices: There is one reference device per each shape category (flat, cuboid and singular).They were full time available and their profiles were fully measured.
- Rest of available devices: They were partially (not full time) available and thus half measured. In that case just increasing temperature was measured in order to get the most representative values (time constant and steady state). They were partially assumed from the reference devices.
- Not available devices: They were not available, difficult to obtain and thus not possible to measure. They were assumed from manufacturer specifications and reference devices.
Reference Devices
They were selected taking into account their external three dimensional outline for them to be representative of their category:
- Flat shape -> LCD TV
- Cuboid shape-> Play Station 2 (PS2)
- Singular shape-> Laptop
Measurement procedure followed in this case consisted on taking temperature values from all the surfaces of the device every minute.
Measurement equipment used were five thermocouples and a digital thermometer
Firstly, after turning ON the device, measures were taken every minute while temperature was increasing until it reached steady state (steady state ranged from 35’ to 80’ depending on the device).Secondly, when steady state was clearly reached (around 90’ after first measure), the device was turned OFF and temperature values were taken until it reached the final room temperature. The final room ambient temperature was slightly over the initial temperature (1 or 2 ºC approximately), due to the heat gains from both the device in operation and the people carrying out the data acquisition.
The values obtained when measuring the reference devices can be seen in the following graphs:
- Flat shape -> LCD TV
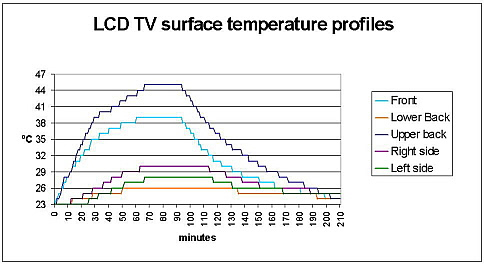
For the case of the LCD Television, the five thermocouples were attached to the main heat emission surfaces of the TV: The front (screen), upper back (cooling grid), lower back, right side and left side.
Figure 1. LCD TV surface temperature profilesAs it was expected, main temperature increase was obtained in the upper back of the TV (where the cooling grid is) and in the liquid crystal screen
- Cuboid shape-> PS2
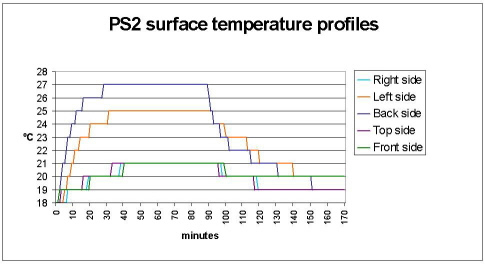
For the case of the PS2 the thermocouples were attached to all the surfaces but the bottom.
Figure 2. PS2 surface temperature profilesHigher temperature values were found in left and back side, were the grid from the cooling fan is located. This remarkable difference between case and fan temperature shows how representative is the role of the fan when analyzing heat emission profiles, as it will be shown later on.
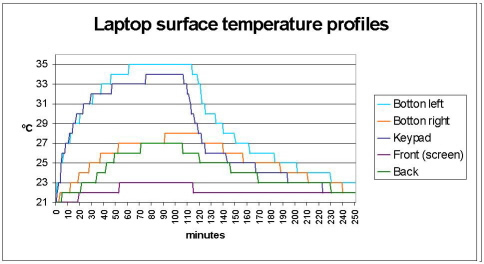
- Singular shape-> Laptop
When measuring the laptop the thermocouples were placed in the bottom (right and left side), front (screen), back and keypad.
Figure 3. Laptop surface temperature profilesMaximum values of temperature were found on the bottom surface and keypad as that surfaces are in contact with main heat sources such us the hard disk or the DVD reader.
All the temperature graphs above show the same typical trend which consists on a first steep increase (after turning on the device), followed by the steady state when the maximum temperature is reached and finally a smooth exponential decrease (after turning off the device) until the ambient room temperature is reached.
Rest of available devices
Rest of available devices were CRT TV, DVD Player, Desktop PC and PC Screen. Just the increasing temperature profile was measured, so their final heat profile was partially assumed according to the reference device of the shape category they belong to.As en example, we can have a look at how the tmeperature profile of the PC screen was worked out:
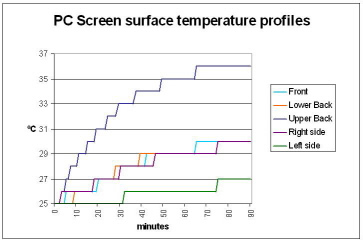
Like in the previous LCD TV example five thermocouples were attached to the different surfaces of the PC screen:
Figure 4. PC Screen surface temperature profilesAs the PC screen belongs to the flat shape category, its temperature profile is expected to be quite similar to the LCD TV one. The higher increase is again found in the upper back thermocouple.
By just measuring the first 90 minutes of work, until the screen reaches the steady state, it is possible to obtain important values of constant time temperature and steady state temperature that, with the support of previous LCD TV measures, would give us enough information for calculating final heat emission graphs, (as shown in the Calculations section).
Not available devices
The last group of devices, as they are very luxurious (plasma TV, Blu ray, etc) were not accesible for measuring, so their heat emission profile was assumed from similar reference devices taking into account the power values found in the manufacturer specifications.Final heat emission profiles are calculated in the Calculations section by using the measurements shown above.
Fan temperature profiles
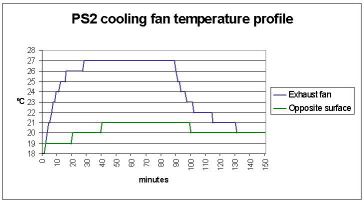
For those devices with cooling fan (PS2, Laptop, Desktop, DVD, Blu Ray), heat is not only emitted by the case. There is a significant amount of heat which is obviously being removed by the fan.In order to analyze this effect, two more thermocouples were attached to de device: one in the exhausting fan grid (outlet temperature) and the other in the opposite surface (inlet temperature).
Measuring procedure was the same as the one followed on the previous measurements, with data taken every minute, from the switching on until the room temperature was reached after the turning off.
Figure 5. PS2 cooling fan temperature profileFan heat emission values are fully explained in the Calculations section.
_profiles