DEMAND PROFILES
Situations considered | Occupants | Usage patterns | Electrical demand profiles | Casual gains
Situations considered
Three different situations of home entertainment equipment within the household are analyzed in this project: the current, the future and the rational future situation. They are based on the type of devices used and their penetration levels. These situations are further explained below:
- Current Situation: represents the present scenario of home entertainment equipment, including totally widespread technologies (such as CRT televisions or PCs) and their actual penetration levels.
- Future Situation: represents the likely future scenario scenario of home entertainment equipment, including devices from the latest technologies (such as Plasma televisions or Blu-Ray players) and assumed penetration levels.
- Rational Situation: includes the same type of devices and penetration levels as the future situation, however, a rational usage of the devices will be considered. This rational usage includes switching off the devices (by unplugging them from the socket) when they are not being used, eliminating the standby and off consumption of the devices
All the devices considered in each situation and their penetration levels [1] are shown in table 1 below:
* Future and rational penetration values assumed.
Table 1. Penetration levels of the devicesOccupants
The dwelling under analysis houses 3 occupants: a couple and their son. Ideal routines of the occupants were assumed for both a week and a weekend day. These ideal routines, shown in table 2 below, form the basis for all the casual gains inside the house: gains from devices, gains from occupants and gains from lighting.
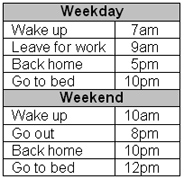
Table 2. Ideal routinesUsage patterns
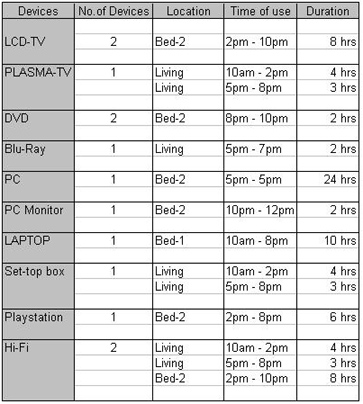
In order to work out the electrical demand profiles of the home entertainment equipment, usage patterns of the devices were assumed for both week and weekend days based on our experience. These usage patterns are shown for each situation in tables 3, 4, 5, 6 below:Typical weekday:
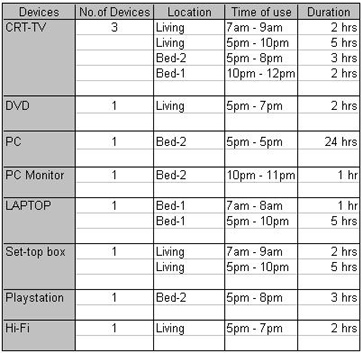
- Current situation
Table 3. Usage patterns for a week day in the current situation
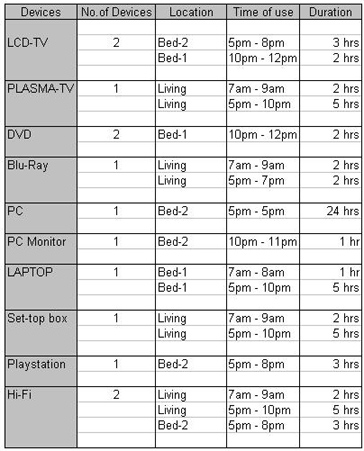
- Future and rational situation
Table 4. Usage patterns for a week day in the future and rational situationTypical weekend:
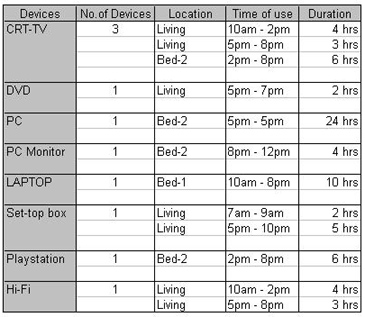
- Current situation
Table 5. Usage patterns for a weekend day in the current situation
- Future and rational situation
Table 6. Usage patterns for a weekend day in the future and rational situationElectrical demand profiles
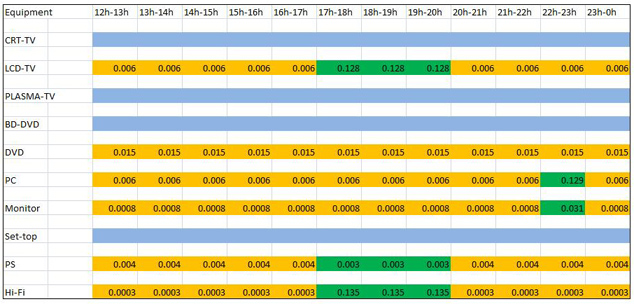
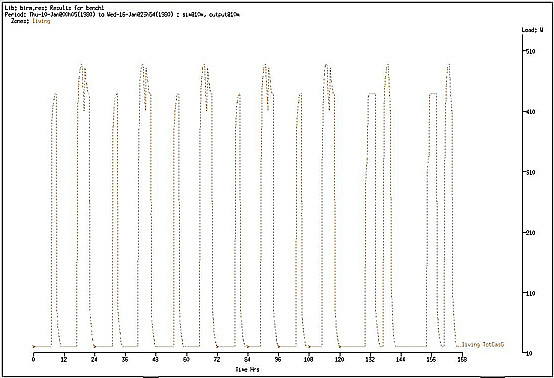
According to the penetration levels and the usage patterns shown above electrical demand profiles were worked out for each zone and each situation for both week and weekend days.As an example, the electrical demand pattern for the living room in the current situation is shown in the figure 1 below.
(Green: ON, Orange: Standby, Blue: OFF/No device)
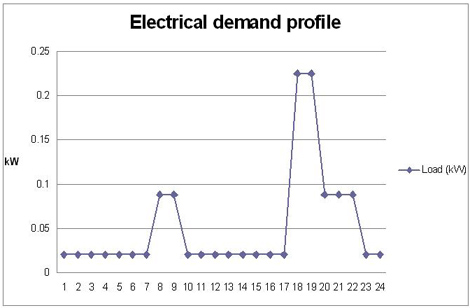
Figure 1. Pattern used for creating electrical demand profile in kW.The following profile is obtained from the above pattern:
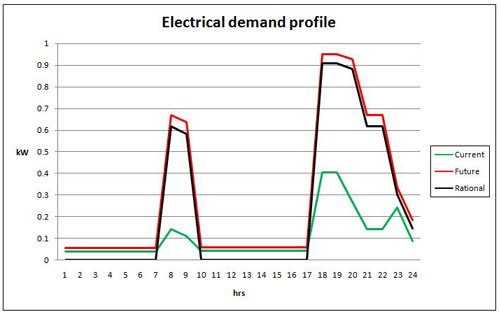
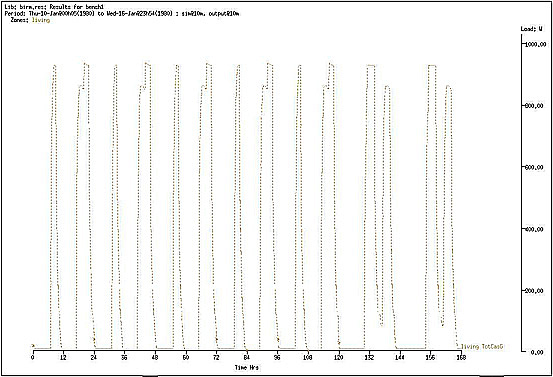
Figure 2. Electrical demand profile for the living room in current situation.The same procedure was used for the rest of the zones in each situation obtaining the following overall electrical energy demand profiles by summing up the zone specific demand values:
Figure 3. Overall electrical demand profile for the three situationsWe can observe from the graph that both standby and off power consumed by HEE is a considerable value and it cannot be ignored.
In order to highlight the effect of HEE on the total energy consumption, the following comparisons are made:
Current vs. Future
- Power consumption is almost doubled due to the increase in HEE.
- Standby power of most of the new equipment is lower than the current one since they are ment to meet more restricitive energy efficiency labels, however, the number of equipments is more in the future situation.
- If observed closely, the big screen televisions like the Plasma or the LCD are the major consumers of power in the future situation. This can be spotted during the latter half of the day while the normal TV viewing hours.
Future vs. Rational
- It is remarkable how much electrical energy can be saved by just switching off the devices when they are not in use. Nevertheless, switched off means either that the device is unplugged from the wall socket or the wall switch is turned off. Because HEE or any device is consuming some power in the off state (turned off using the off switch on the device
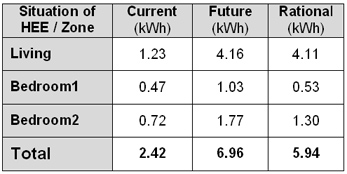
Total electrical energy consumed per day in each zone in the three different situations shown below:
Table 7. Energy consumed per day
Casual gains
The electrical energy demand profile is used to calculate the heat gains values from the HEE. The heat output from the devices is obtained from the heat profiles ( as shown in the Calculations section).
With those values, casual gain regimes with values every 10 minutes were worked out for the whole year and exported to the model.The way these casual regimes are calculated is further explained in the example below:
Example: if a device is turned ON at say 8pm, the heat gains from the equipment are input every 10 min as calculated in from the heat profiles (link to table). The values are constantly increasing until the equipment reaches the steady state. This steady state heat output value is retained until the point at which that device is turned OFF. Once the device is turned OFF, the way down heat gain is input until the heat output reaches the value of the standby power (if the device is going to be kept in standby) or the temperature of the device reaches the room temperature (if the device is plugged off).
Total casual gain regimes:
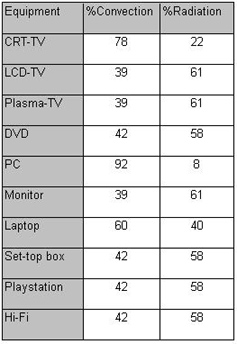
The total casual gain at a particular time interval is the sum of casual gains from the HEE and other gains.The following percentage convection and radiation values [2] of heat transfer were considered for the home entertainment equipment:
Table 8. HEE convection and radiation valuesOther casual gains include lighting and occupancy gains. The assumptions made for calculating these gains are shown below:
Lighting
Type: 40W Tungsten bulbs for lighting
Distribution: Two bulbs in the Living and one in each of the bedrooms.
Heat transfer: 50% Convective, 50% RadiativeOccupants
Number: Maximum of 3 occupants
Gains: 90W per person at normal activity level (at rest)
Clothing level: 0.7
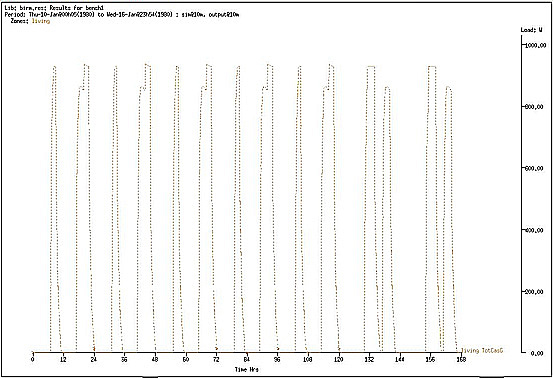
Heat transfer: 70% Convective, 30% RadiativeOverall casual gains obtained for the living and already exported to the ESP-r model are show below for a whole week:
- Current situation
Figure 4. Weekly overall casual gains for the living in the current situation
- Future situation
Figure 5. Weekly overall casual gains for the living in the future situation
- Rational situation
Figure 6. Weekly overall casual gains for the living in the rational situationOnce all the overall casual gain regimes from each situation were worked out, they were exported to the model of the dwelling so three different models were achieved:
The dwelling with:
1. The casual gains from the current home entertainment equipment
2. The casual gains the future home equipment will emit
3. The casual gains emitted by the future equipment being used rationally
[1] Market Report, Key Note, 2002.
[2] H.Hosni, Mohammad., W.Jones, Byron., M.Sipes, Jerry., and Xu, Yue. Total Heat Gain and the Split Between Radiant and Convective Heat gain from Office and Laboratory Equipment in Buildings. ASHRAE.1998.

_profiles