HOME ENTERTAINMENT EQUIPMENT CALCULATIONS
Final temperature profiles | Heat from the case | Heat from the fan | Final heat profiles | Heat assumptions | Casual gains
Final temperature profiles
The temperature values obtained from the measurements were those measured in each surface of the device. However, each surface has a different area so its contribution to the final heat emission profile will not be the same, it will significantly vary depending on the area.Thus, prior to working out final temperature profile as an average of the five series of temperature values from each thermocouple, a correction factor needs to be applied according to the relative area each thermocouple is covering on the device.
First of all, the area of each measured surface is calculated. Then it is divided by the addition of the total area and so a correction factor is obtained for each surface.
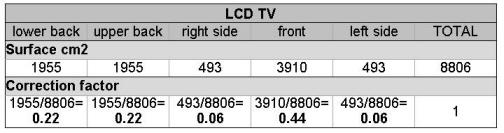
As an example, it can be seen in the following table how this correction factor is calculated for the case of the LCD TV:
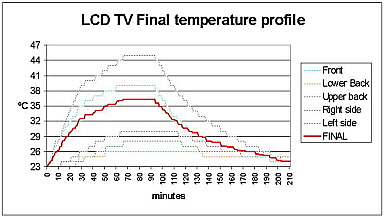
Table 1. LCD TV correction factorsNext step consists on multiplying this correction factor by the temperature values of its own surface in order to get the final temperature profile:
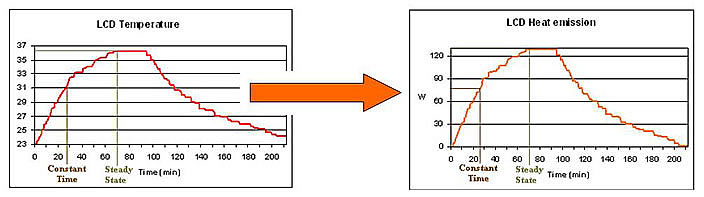
Figure 1. LCD TV final temperature profileHeat from the case
It is known that the energy consumed by the devices will turn up into heat. According to this, the heat profile emitted by the case was worked out from the temperature profile using a linear correlation and considering the following assumptions:At initial time -> Heat emission, Hi = 0 W
At time constant -> Heat emission, Hτ = 63% Rated power
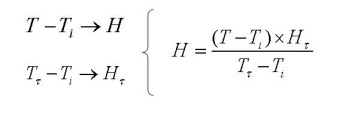
At steady state -> Heat emission, Hss = Rated powerIn the case of the reference devices, the increase of heat emission after switching ON the device (from 0 to 90 minutes) was calculated applying a linear correlation between the known values:
Ti: Initial temperature [ ºC ]
Tτ: Temperature at the time constant [ ºC ]
Hτ: Heat at the time constant [ W ]
T: Temperature at any time [ ºC ]And the unknown values:
H: Heat at any time [ W ]
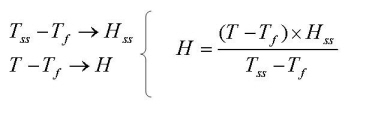
After switching OFF the device (from 90 to final time), we proceeded on the same way, a linear correlation between the known values:
Tf: Final temperature [ ºC ]
Tss: Temperature at the steady state [ ºC ]
Hss: Heat at the steady state [ W ]
T: Temperature at any time [ ºC ]And the unknown values:
H: Heat at any time [ W ]
The result of applying the formulas above is shown in the following graphs:
Figure 2. Linear correlationHeat from the fan
In those devices including fan, a significant amount of heat is removed by it. This heat needs to be calculated and considered when working out the final heat emission profile.For obtaining the heat drained by the fan the following formula is applied:
Q=m· Cp ·(Toutlet–Tinlet)m: mass flow rate m=ρ·q
ρ: air density: 1.195 [kg/m3] at 22.5 ºC
q: fan flow rate: from device specifications [m3/s]
Cp: specific heat: 1012 [J/Kg K] for air in typical room conditions
Toutlet: outlet temperature (measured in the exhaust fan)
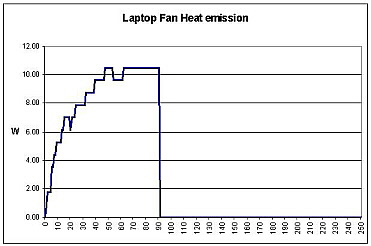
Tinlet: inlet temperature (measured in the opposite surface)As an example, it can be seen in the graph below the heat emitted by a laptop's fan from the moment it was turned ON (0 min) until it was turned OFF (90 minutes):
Figure 3. Laptop fan heat emissionIn this case just a 30% of the heat comes out through the fan, and the rest 70% is emitted by the surface. This is not a very common result for the percentage of heat emitted by the fan (it is usually higher).The reason is due to the fact that laptop hard drives and optical devices are commonly cooled by having them in contact with the computer’s frame, increasing the surface which can radiate and exchange heat.
For other devices the percentage varies more signicantly:
Blu ray-> 48% heat emitted by the fan and 52% heat emitted by the case
Desktop-> 75% heat emitted by the fan and 25% heat emitted by the caseFinal heat profiles
There are two different cases when calculating final heat profiles: the devices with cooling fan and the devices without cooling fan.For those devices without cooling fan, as all the heat is emitted by the case, final heat trend is exactly the same as the one already calculated by linear correlation.
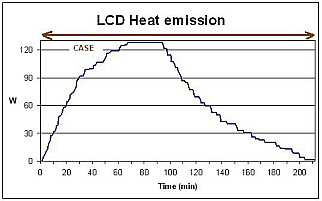
This is the case of the LCD Television, having the same trend as the LCD TV temperature profile, as shown below:
Figure 4. Final LCD heat emissionFor those devices with cooling fan, heat is emitted both by the case and the cooling fan while they are working (until minute 90), and just by the case once they are turned off (from minute 90 in advance).
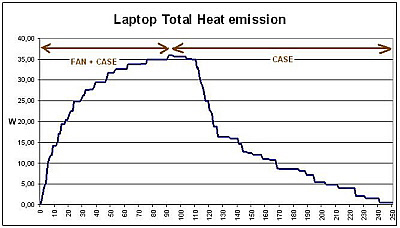
This is the case of the laptop for example, whose heat emission profile can be seen in the following graph:
Figure 5. Final laptop heat emissionFor the first part of the graph, heat from the fan and heat from the case were added, giving us the total heat emitted by the device while it was working. Once the device was turned off, heat comes just from the case and the graph is the same as the one calculated from the temperature linear correlation.
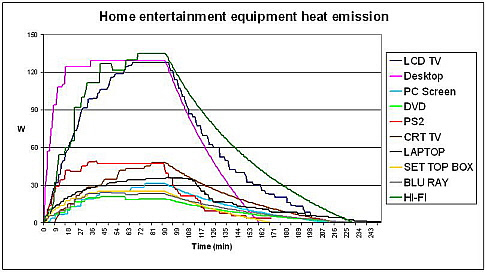
In the following graph, a comparison between the heat emitted by all the devices under study (with the exception of the Plasma TV which graph is much greater than the rest), can be seen:
Figure 6. Fnal home entertainment equipment heat emissionFrom the graph it can be inferred that HI-FI, LCD TV and Desktop have the highest heat emissions.
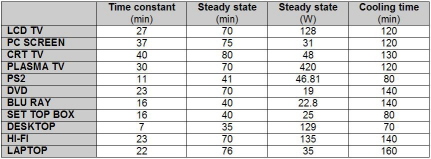
On the following table, some representative data including time at which steady state is reached, steady state value and cooling time needed for reaching the new ambient temperature is shown for each device:
Table 2. Heat profiles dataHeat assumptions
Heat emission trend from the groups “rest of available devices” and “not available devices” was calculated taking into account some assumptions.For the group of “rest of available devices” calculations were almost the same as for the reference devices, with the only exception of the non measured decreasing part of the graph.
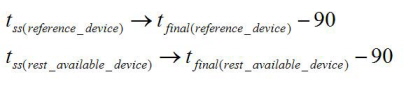
First of all, as the final time was not known it was inferred from the following relation of steady state times between the reference devices and the rest of available devices:
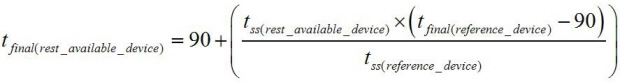
In the reference devices, there is a measured decreasing time (t_final) for each measured increasing time (t_ss). Whereas, in the rest of available devices, for each measured increasing time (t_ss), a decreasing time is calculated using the following formula:
Once the final time in which the device reaches the steady room temperature is calculated, the decreasing part of the graph is assumed from a generic exponential curve.
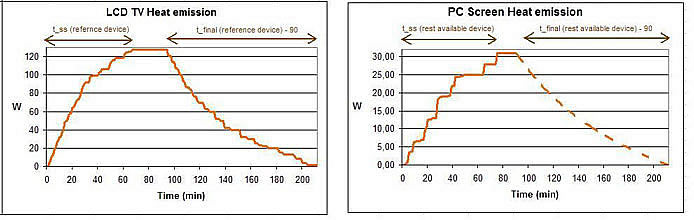
As an example, it can be seen in the following graph how the decreasing part of the heat emission trend of the PC Screen (rest of available devices) is obtained from the heat emission trend of a LCD TV (reference devices):
Figure 7. Rest of available devices assumptionThe decreasing part of the PC Screen graph is assumed as a decreasing exponential curve, considering there will not be a big difference between that and the real one.
For the group of “not available devices”, as no temperature data was measured, heat emission trends were fully assumed and thus directly obtained from the reference device according to the shape category each not available device belongs to.
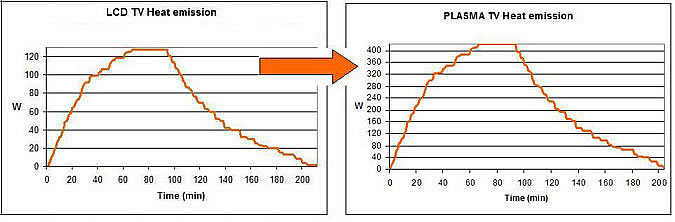
This is the case of the plasma TV for example, as it is shown in the figure below:The heat emission for a plasma TV (not available device) was directly obtained using the same trend as the one from a LCD TV (reference devices) but modifying the new values of power consumptions.
Figure 8. Not available devices assumptionThe heat emission for a plasma TV (not available device) was directly obtained using the same trend as the one from a LCD TV (reference devices) but according to the new values of power consumption.
Casual gains
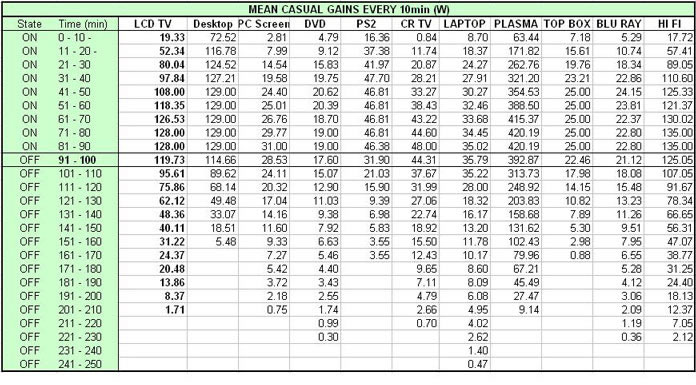
Once the heat emission profiles were worked out for all the devices under study, mean casual gains were calculated every ten minutes directly from those profiles:
Table 3. Mean casual gainsThese values allow us to know exactly how much heat is being emitted by each device at anytime, allowing us to simulate how the devices perform within the house, as it is further explained in The Model section.