Solar PV
Solar photovoltaic (PV) panels are now the fastest growing source of power generation worldwide (Solar Power Europe, 2018[2]). Correspondingly, the price of PV has dropped precipitously over the past decade, and their efficiency has increased with focused R&D investment. The cost of solar PV is such that there is a strong argument for them to be installed as standard on all new buildings. Their omission from the designs so far submitted for Queens Quay, with its aspirations to be a sustainability exemplar, is conspicuous.
In attempting to assess the potential for onsite PV panels to contribute to the energy requirements of the onsite heat pumps, an estimate needs to be made of the available roof area. This is necessarily an approximate figure as detailed plans for the site have not been submitted. At the time the calculation was done, the only detailed plans available were for the areas denoted as 'Sites A and B' on the masterplan shown here. These are the affordable flats to be owned by West Dunbartonshire Council. The masterplan also deliniates the uses of the various blocks on the site: the eastern end of the site comprising of shops, restaurants, other commercial premises and the affordable flats. The health centre and care home are located in the centre, with conventional private dwellings mainly concentrated on the western side.
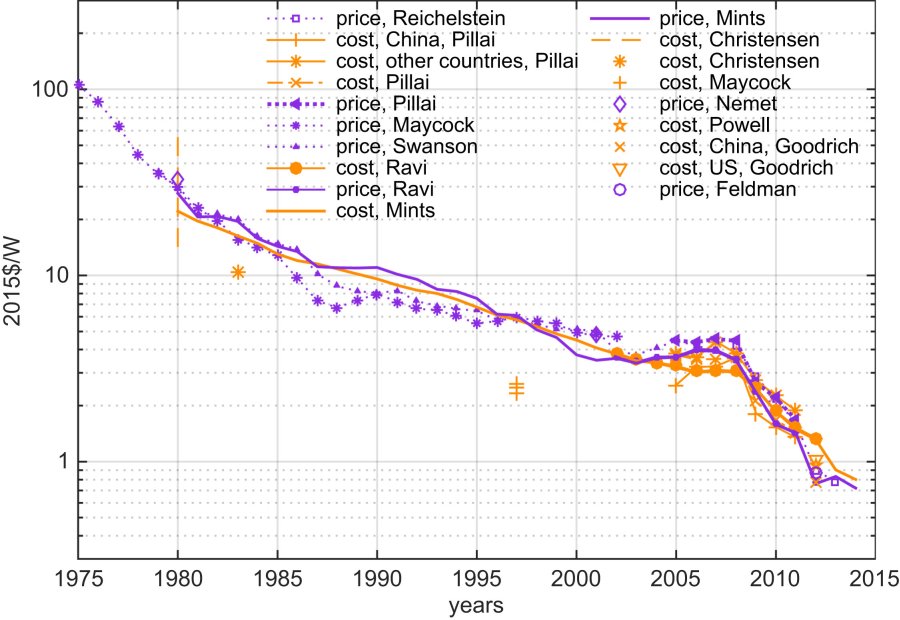
PV panel prices per Watt over time (adjusted to 2015 prices. Note logarithmic scale) from Kavlak et al (2018)[3]
As a working assumption then, the blocks on the eastern side are used to calculate the available roof area. These blocks are closest to the Energy Centre housing the heat pumps, and as commercial units and social housing are typically owned on a rental basis rather than purchased outright. In the Clean Heat Vision it is also assumed that there is no significant shading of one building by another, though as the plans submitted so far show flat or near-flat roofs the self-shading of racked panels is accounted for.
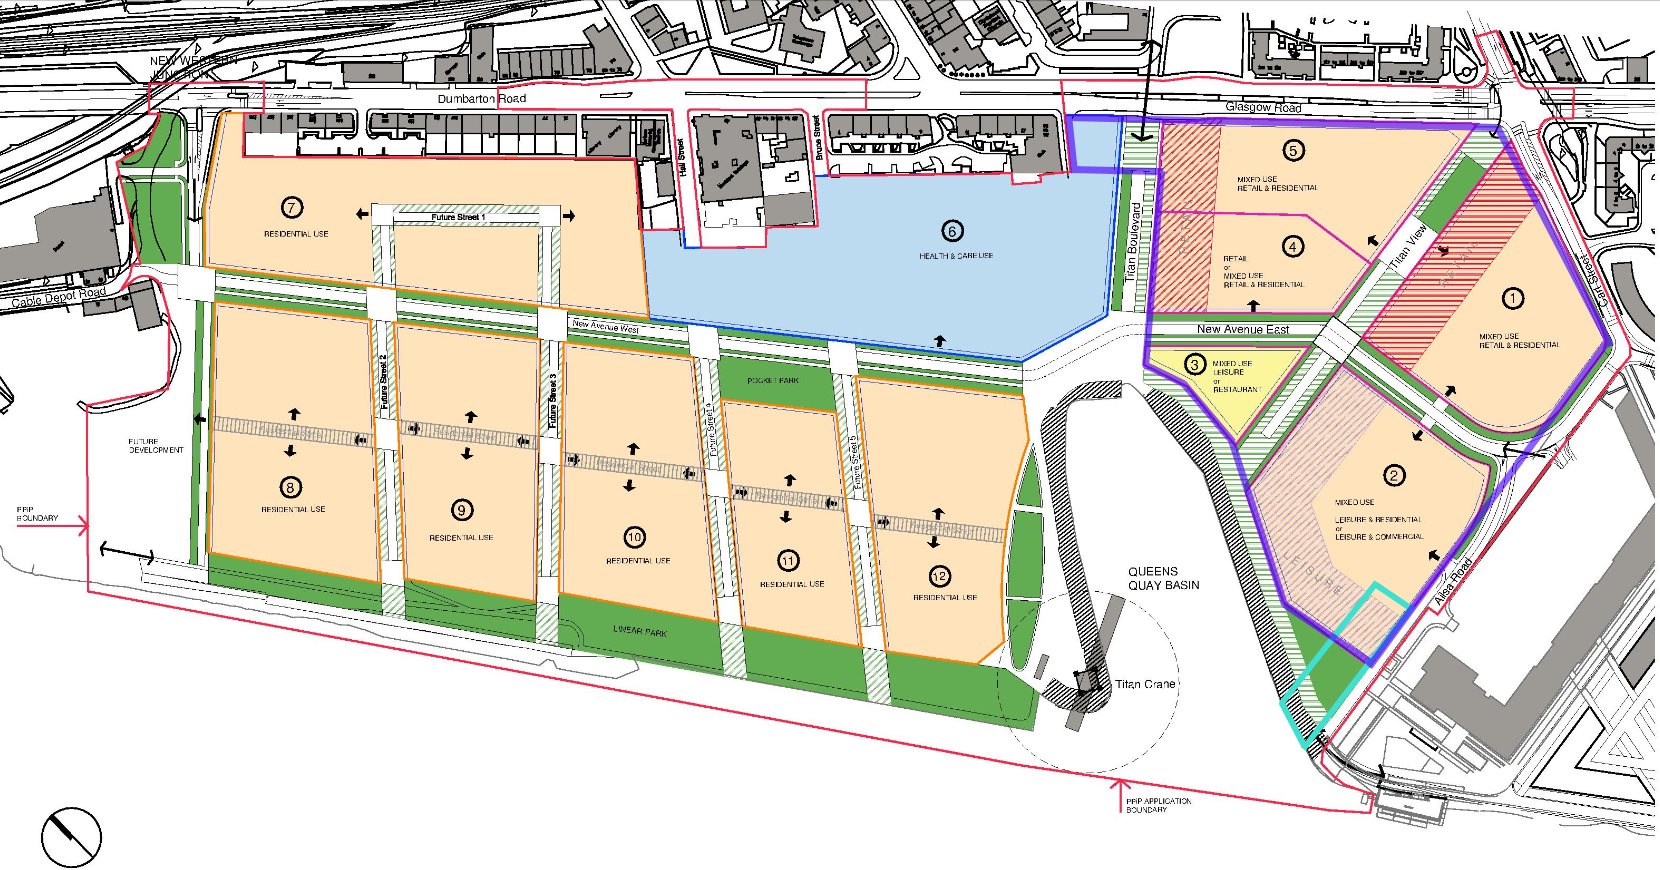
Queens Quay masterplan[4]. The site of the energy centre (defined in planning application DC17/231) is outlined in thick turquoise. Sites examined for solar potential are outlined in semitransparent indigo: sites 1-5 plus a small section of site 6 ("Site B" in application DC17/231) allocated for affordable housing. If you are using a mouse, hovering over the map will highlight each site.
| Site | Site footprint area | Roof area | Number of panels | Capacity (kWp) |
|---|---|---|---|---|
| Site A | 7,140m2 | 2,150m2 (measured from plan) | - (see note) | - (see note) |
| Site B | 1,200m2 | 451m2 (measured from plan) | 257 | 77.1kWp |
| Site 1 | 14,500m2 | 4,877m2 (extrapolated) | 2,780 | 834kWp |
| Site 2 | 15,600m2 | 5,250m2 (extrapolated) | 2994 | 898.2kWp |
| Site 3 | 3,000m2 | 1,010m2 (extrapolated) | 576 | 172.8kWp |
| Sites 4 & 5 | 18,200m2 | 6,100m2 (extrapolated) | 3489 | 1,046.7kWp |
| Totals | 10,096 | 3,028.8kWp |
Calculations of the possible solar PV capacity for modelling, assuming 300W solar panels and a margin of 8% of roof area to allow for plant and irregularity. Note that site A as defined in planning application DC17/231 is included in the contiguous sites 4 & 5 on the masterplan.
In reality the amount of available PV is a highly mobile feast - in one direction, shading could be a significant issue, but in the other, PV panels could be installed in non-roof areas (above car parking) or on facades.
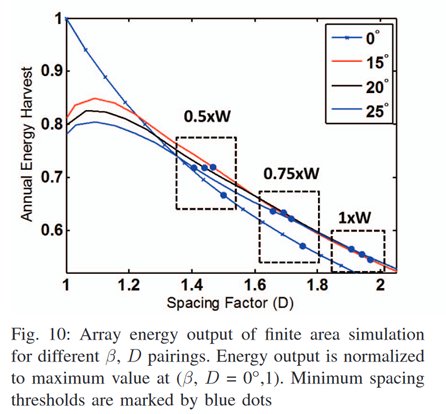
The above PV capacities were modelled using PVsyst to evaluate system losses due to inverters, wiring resistance, thermal inefficiencies and power mismatching. Array geometries were devised based on analysis by Galtieri and Krein (2015)[5], which found that counter-intuitively shallow angles for solar panels would result in improved energy harvests. The benefit of shallower angles is also increased when a site is subjected to higher proportions of diffuse light as compared with direct sunlight. Glasgow tops one list of the least insolated city in Europe[6], receiving an average of 1,203 hours of sunlight per year compared with the UK average of 1,372[7].
A spacing factor (D) of 1.4 (see figure) was used with a elevation angle of 15 degrees. 49 inverters were used across the site and the resultant aggregated system losses over the year were calculated by PVsyst as 7.3%. This was then transferred into energyPRO, which also models PV arrays with self-shading. The output from the five PV arrays simulated by energyPRO was a total of 2.32GWh over the year. This represents a capacity factor of 8.8% - for comparison the 2013 DECC guidance figure produced for the UK in general is 9.7%. This demonstrates that, high in latitude and low in sunlight though the site may be, the difference is not as significant as might be thought and PV is certainly worth implementing in Glasgow.
The pattern of daily PV production, as modelled in energyPRO based on CSRFv2 weather data for 2018, is shown below.
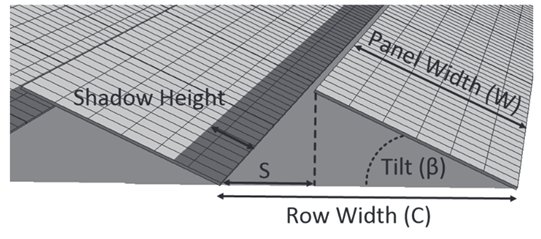
The effects of array geometries on self-shading. The spacing factor D is equal to row width (C) ÷ panel width (W) (Galtieri and Krein, 2015[5])
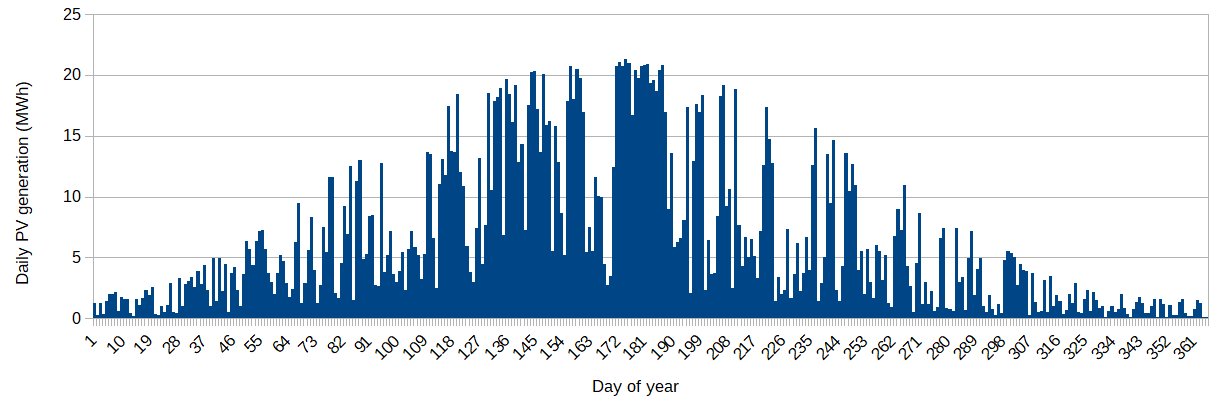
Daily PV generation for all sites, modelled by energyPRO over the year 2018
Local "spill" wind
As has already been described, wind producers across the UK grid system often face being 'curtailed' - being required to reduce or entirely stop generation for the grid. This occurs either because other nondespatchable generation is exceeding demand or because of constraints in the network which prevent the transmission of electricity from generator to demand without causing some parts of the network to exceed set limits (for instance, safe operating temperatures or supply frequency). Curtailed generation has grown significantly, increasing from 45GWh in 2012 to 1123GWh in 2016. Onshore wind in Scotland has very high curtailment rates - the volume-weighted average is 10.61% of their annual output. For comparison the volume-weighted average curtailed generation for onshore wind in Germany is 2.98%. One of the most significant factors in this is the congestion of the network between Scotland and England (Joos and Staffell, 2018[8]).
In some cases where the local distribution network is constrained, one strategy for allowing new renewable generation to connect to the grid is to match it with a responsive local demand - in the industry terminology this is called Active Network Management (ANM), allowing a "Flexible Connection Solution" (SP Power Systems, 2017 [9]). The presence of a thermal store in a large district heating network allows some control over demand and therefore could potentially play a role in a demand side response to grid constraints.
In the absence of historical data on grid status, our model incorporates the concept of 'spill wind' - wind power that is only available during periods of high generation. Due to the high penetration of wind power in the Scottish grid, it is this highest output that is most likely to be curtailed. If a responsive local market could be found for this most intermittent top slice of wind generation, this could lessen the effect on the wider grid, potentially allowing greater wind penetration and thereby helping the ongoing transition to a zero carbon grid. In Scotland, periods of high wind speeds are also where the local electricity grid is likely to be at its lowest carbon intensity and the price of electricity is at its lowest.
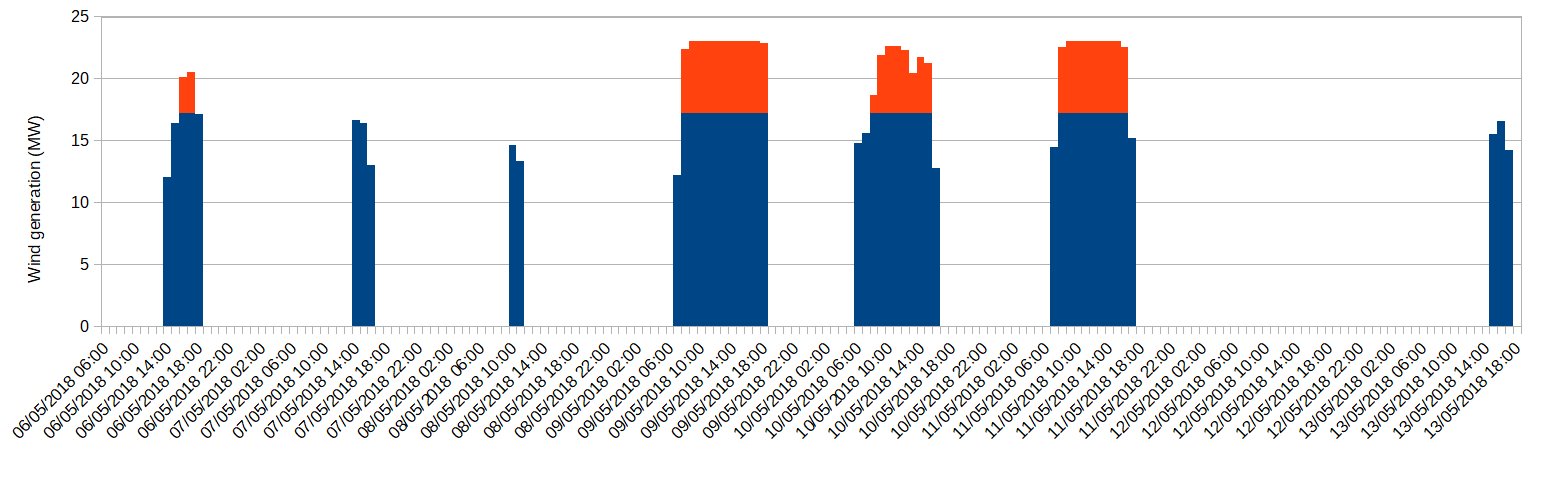
An illustration of how 'spill wind' (shown in red) above a 75% threshold is derived from total generation.
Currently, most operators of wind generation assets are compensated for periods of curtailment through the Renewables Obligation Certificates (ROCs) system - they are compensated for the value of the ROCs that they will forego. This regime essentially came to an end in 2017 - it is no longer available to new generators and existing contracts will not be renewed once complete (typically after 20 years) [10]. There is therefore a renewed drive to investigate local uses of wind power that would otherwise be curtailed.
Clydebank has an abundance of local wind energy, being around 13 miles away from Whitelee wind farm, the UK's largest onshore windfarm. As a starting point, our model considers that the spill wind available is that above a 75% threshold from 10 of Whitelee's 215 turbines. Using the characteristics of the Siemens SWT-2.3 turbine (The Windpower, 2018[11]), the most common model on the site, a spill wind power curve was created and generation was modelled using 2018 wind data.
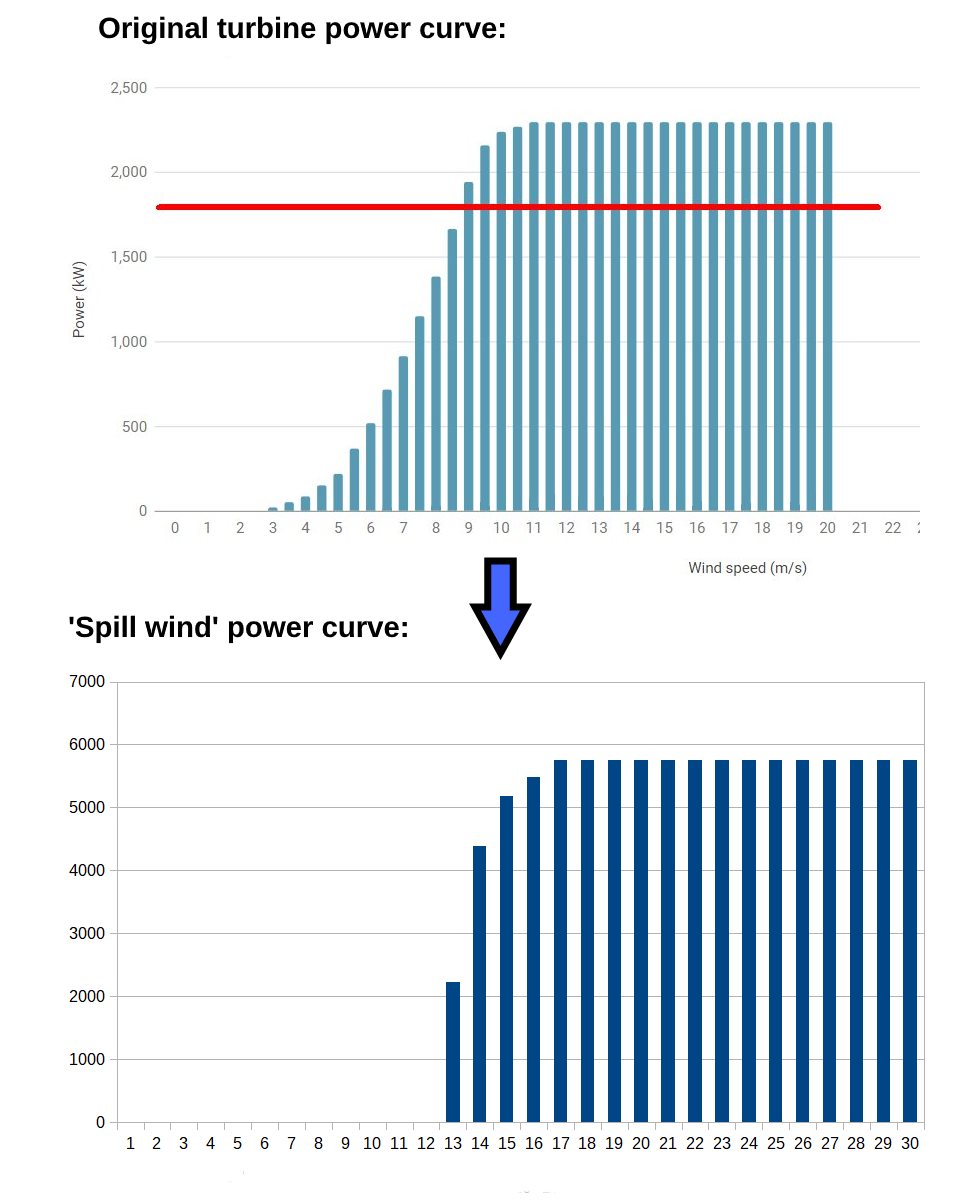
Creating the 'spill wind' power curve from the original turbine data.
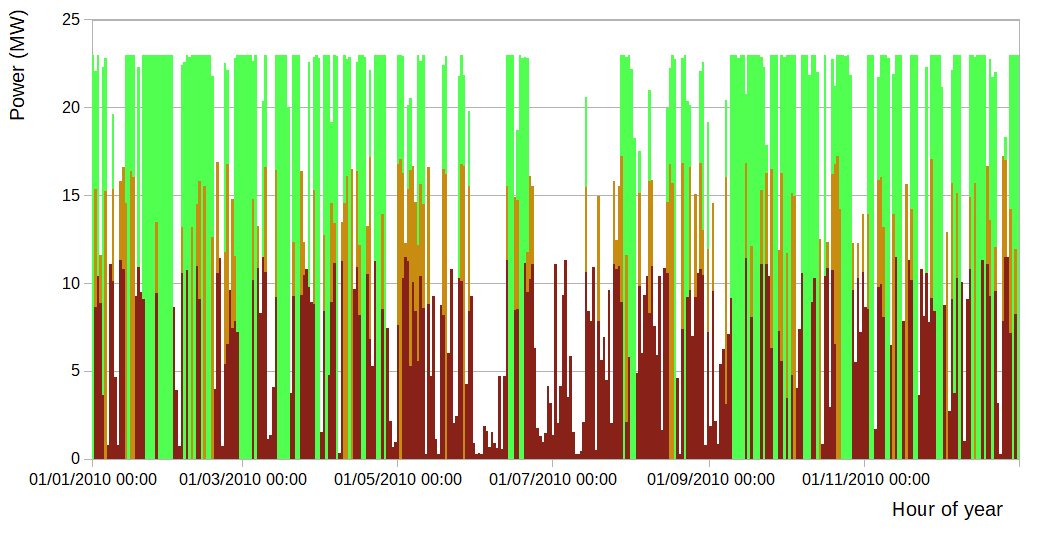
Periods of 'spill wind': hours (shown in green) in 2018 where generation, as modelled in energyPRO, exceeds 75% of rated capacity