• Home
  • OVERVIEW
    • Motivation
    • Policy
    • District Energy
    • Main heat source selection
    • Case study: Kinlochleven
    • Methodology
  • THE PROJECT
    • Heat Demand Assessment
    • Network Modelling
    • Network Design
    • Assessment of potential renewable sources
    • Environmental Impact
    • Financial Assessment
  • CONCLUSIONS
    • Final review
    • Sensitivity Analysis
    • Further Work
  • RESOURCE CENTER
    • Acknowledgements
    • References
    • Downloads
  • THE TEAM
  • Home
  • OVERVIEW
    • Motivation
    • Policy
    • District Energy
    • Main heat source selection
    • Case study: Kinlochleven
    • Methodology
  • THE PROJECT
    • Heat Demand Assessment
    • Network Modelling
    • Network Design
    • Assessment of potential renewable sources
    • Environmental Impact
    • Financial Assessment
  • CONCLUSIONS
    • Final review
    • Sensitivity Analysis
    • Further Work
  • RESOURCE CENTER
    • Acknowledgements
    • References
    • Downloads
  • THE TEAM

Heat Demand Assessment

​Definition of the heat demand
The first aim of our Team was to define the demand profile of Kinlochleven Community.  At initial stage information was gathered from the heat map provided by the official website of the Scottish Government.
Picture
Overview of Kinlochleven
Picture
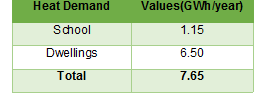
Results from heat map
​Kinlochleven is divided into three main areas as it is shown in the map above. The village consists mainly of dwellings, a school and an ice climbing centre. The colours in the heat map represent the magnitude of the heat demand. The ice climbing centre will not be considered in this analysis as they currently use rejected heat from refrigeration processes to heat the building. The total heat demand can be observed in the following table:
Picture
 Annual heat demand
Validation of the heat demand
The heat demand data collected from the Heat Map were validated with the use of the following tools:
  • CIBSE TM46 defines energy consumption benchmarks for public buildings. For schools and seasonal public buildings, the typical annual heating benchmark is 150 kWh/m2. Knowing the area of the school to be 7,400 m2, the calculated consumption for the school is 155 kWh/m2, which is in line with the benchmark.
 
  • HEM software calculates energy demand of dwellings based on factors such as the type of building, year of construction, level of insulation, ventilation, etc. A survey was conducted to determine the number and energy consumption of each type of dwelling. As it was not possible to gather information about the individual dwellings, a weighted average was considered.
The results and the U-values used for the calculation can be seen in the following tables:
Picture
Energy consumption of different types of households
Picture
U-values of construction elements for different insulation levels
Create a free web site with Weebly