• Home
  • OVERVIEW
    • Motivation
    • Policy
    • District Energy
    • Main heat source selection
    • Case study: Kinlochleven
    • Methodology
  • THE PROJECT
    • Heat Demand Assessment
    • Network Modelling
    • Network Design
    • Assessment of potential renewable sources
    • Environmental Impact
    • Financial Assessment
  • CONCLUSIONS
    • Final review
    • Sensitivity Analysis
    • Further Work
  • RESOURCE CENTER
    • Acknowledgements
    • References
    • Downloads
  • THE TEAM
  • Home
  • OVERVIEW
    • Motivation
    • Policy
    • District Energy
    • Main heat source selection
    • Case study: Kinlochleven
    • Methodology
  • THE PROJECT
    • Heat Demand Assessment
    • Network Modelling
    • Network Design
    • Assessment of potential renewable sources
    • Environmental Impact
    • Financial Assessment
  • CONCLUSIONS
    • Final review
    • Sensitivity Analysis
    • Further Work
  • RESOURCE CENTER
    • Acknowledgements
    • References
    • Downloads
  • THE TEAM

Assessment of potential renewable sources

One important part of our project analysis was to investigate the local potential renewable energy resources which could be implemented in the network. The analysis was divided into two parts:
​1. Thermal energy sources
Solar thermal analysis
A study was conducted to examine the possibility of implementing solar thermal panels into the district energy network. The first step was to assess the solar resource in the area. The following pictures present the solar path above Kinlochleven at different periods of the year. 
Picture
Picture
                                            Winter solar path                                                                                                               Summer solar path
In order to maximise the solar energy captured in a whole year in the Northern hemisphere, the solar panels should face towards the South.​It can be seen that Kinlochleven is located in a deep valley surrounded by mountains which obstruct the Sun’s irradiation to the area. 
Picture
South-facing view of Kinlochleven community 
Following this, the Team modelled the obstacle that these mountains represent in the PVSyst software. The method was based on measuring distances, altitudes and angles with respect to the centre of the village. The results can be seen in the following pictures.
Picture
Topography of the area
Picture
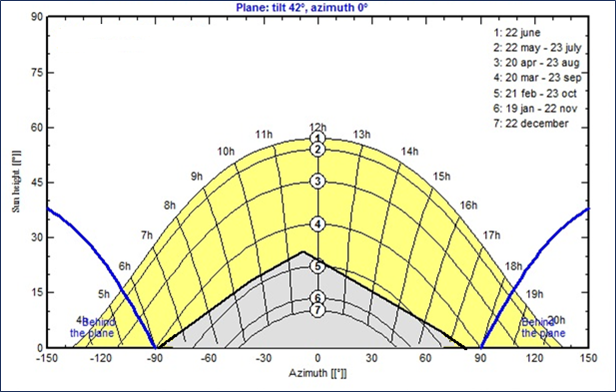
Obstacle modelling in PVSyst
​As a result of this analysis it can be concluded that the global solar irradiation is reduced by 15% due to the topography of the area. The following graph represents the influence of the mountain's shadowing at the different months of the year.
Picture
Comparison of the monthly solar irradiation
​A set of data was collected to define the tilt angle and the efficiency of the panels, the energy generated, the capital cost and the cost of energy per kWh. Findings in the literature revealed that the best orientation of the panels is facing towards the South with an optimum tilt angle of 41°. The distribution of the thermal energy collected by the solar panels throughout the year can be seen in the picture below:
Picture
Annual solar thermal energy production 
Based on various manufacturer's data, the current prices for cost of installation of solar thermal panels​ are on average £250 per m2. As a result of this, taking into consideration the output of the panels calculated in PVSyst, a repayment period of 15 years and an interest rate of 3%,  a cost of energy of 8 p/kWh was found.
To conclude, we believe that this technology is not feasible at this time, as it would be more cost-effective to run the heat pump with grid electricity. However, in the future it can be viable as lower component prices and subsidies from the government can be offered.
​2. Electricity sources
Our project investigates the development of a 4th generation district energy network based on a water source heat pump. Part of our analysis was to examine all the possible renewable energy sources available to generate electricity to feed the heat pump.
​1. New built facilities​
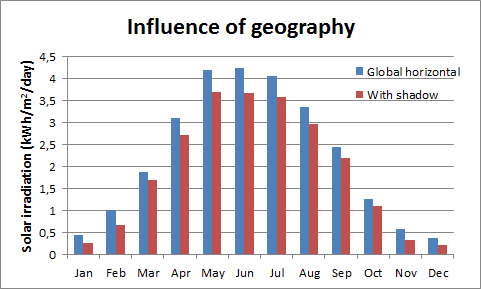
​Solar PV analysis
​​Kinlochleven is located in the West coast of Scotland which has a limited solar resource of about 850 kWh/m2/year. Moreover, as it is already stated and explained in the Solar Thermal Analysis there is a shadow from the mountains which further reduces the solar irradiation by 15%.
Taking into consideration the current prices of solar PV panels (£1,200 per kW installed) and a payback period of 15 years with an interest of 3%, the price of the electricity generated by the system would be 15.5 p/kWh. This price would be reduced by the corresponding Feed in Tariff at that time. 
Picture
UK solar map, Source: European Commission
Wind analysis
Our first aim was to investigate the potential of installing wind turbines near the community. In order to do this, the first step was the assessment of the wind resource in the area by using the NOABL wind speed database.
It can be seen that there is a potential wind resource around the community with wind speeds reaching 10 m/s in some areas. However, a suitable terrain has to be found which would fulfill the following requirements:
  • Reduced slope
  • Reduced turbulence
  • Connection to existing road network
Our proposal for the site would be the area surrounding Loch Eilde Mor, which has a good wind resource with an average speed of 7.5 m/s, is reasonably flat and has an existing connection to the road network. 
Picture
Map of Kinlochleven. Source: Google Earth
Picture
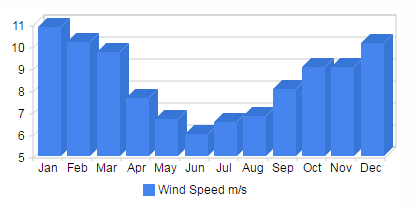
Wind speed map of Kinlochleven. Source: Rensmart
​For the proposed location, the monthly average wind speeds were calculated and they are presented in the following figure.
Picture
Monthly average wind speed. Source: Homer
In order to validate these data, three different locations in the West coast of Scotland were chosen for comparison:  Campbeltown, Islay and Ayr. Using historical data for wind speeds in these locations between 2000 and 2010, the monthly average speed for every location was calculated. Campbeltown was chosen as the most representative location since it is not as exposed as Isle of Islay but has an annual wind speed which matches better the results found in Kinlochleven than those corresponding to Ayr.

Next, the value of the Weibull (k) that better matches the data from the Campbeltown weather station was calculated to be k=2. The validated wind speed data were incorporated into the Homer software, which calculated a capacity factor of 35%, which is consistent with values from the literature, which point out to capacity factors between 30 -50 % depending on the location.

​The equivalent cost of the electricity for this system was calculated to be 5.7 p/kWh, based on current prices for wind turbines at £1,400 per kW installed and taking a loan repayment period of 15 years with an interest of 3%.
​Hydro Scheme analysis
Another renewable source of electricity generation could be to exploit the hydro potentials around the community. Therefore, our team performed a hydro analysis.  In 2011, two hydro schemes with a total power of 67 kW and 100kW were proposed by the Kinlochleven Community Trust.
The characteristics of the proposed schemes are presented in the Picture and Table below.
Picture
Map of hydro scheme proposal. Source: Locogen
Picture
Hydro scheme characteristics. Source: Locogen
​Taking these data into consideration, the calculated cost of electricity for the 100 kW scheme would be 21.5 p/kWh for a loan repayment period of 15 years and an interest rate of 3%.
 2. Existing facilities
​

Hydro- There is currently a 20-MW hydro scheme in the Blackwater Reservoir, which is situated 6 km East of the community. This facility is operated by a private company and currently feeds the grid. If there could be an agreement between this private company and the Kinlochleven community trust, part of this electricity could be provided to the community at a goodwill rate.

Wind- Given the recent development of both onshore and offshore wind farms in Scotland, the Community Trust could come to an agreement to buy green electricity provided by those wind farms to be used in the district energy network. The network could be also used as a way to accommodate possible excesses of electricity in the grid and to minimise the curtailment of wind farms.
Picture
Cost comparison of renewable technologies
​​Analysing the cost of the different renewable technologies, it was decided to go ahead with both the Existing Hydro- if available- and Wind.
Renewable Energy Integration
Integrating energy coming from renewable sources into a system is not an easy task. The power output is stochastic and variable. Therefore, the key to maximise the use of renewable electricity is to implement optimal thermal storage. This means that when there is plenty of electricity available then this can be used to power the heat pump and to store the heated water in the storage tank even if there is not currently demand to cover. This stored energy can be used later on when needed. Implementing this concept can lead to lower CO2 emissions.
The size of the storage plays a fundamental role in accommodating renewable energy. Increasing the size leads to larger amounts of renewable energy being used. On the other hand, bigger size means increased thermal losses and capital costs.

Picture
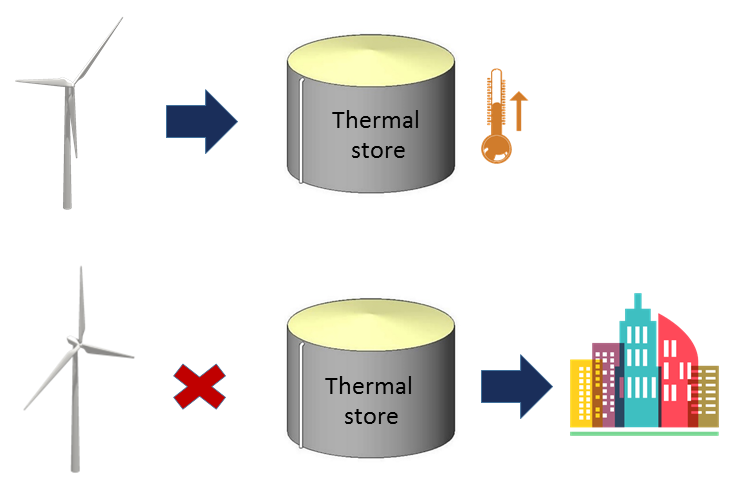
Schematic operation of thermal storage
The parameter used to measure the renewable energy integration is the renewable penetration, which is defined as the fraction of the load that is met by renewable energy. This factor varies both with the type and size of renewable energy available and the size of the thermal store.
We modelled our system in the Homer software, considering the heat pump's consumption throughout the year (generated with EnergyPlan software) to be met with the electricity being generated by wind turbines when available and with grid electricity for the rest of the time. 
The load was modelled as deferrable, showing the fact that the load does not have to be met at a specific time of the day, but instead can be shifted depending on the availability of wind energy.
In order to meet the net annual electricity consumption of the heat pump, two 800-kW wind turbines would have to be installed. However, it can be observed that due to the stochastic behaviour of the wind resource, the renewable penetration never reaches 100%.

​The following table illustrates the influence of the number of turbines on the renewable penetration:
Picture
Picture
        Renewable penetration as a factor of number of wind turbines                                                           Schematic of modelling in Homer
Create a free web site with Weebly