
- General Considerations
- Specific Considerations

Mabie Farm Park - Solar
The visitor centre/tearoom at Mabie Farm Park has a south facing roof area of 25 m2 at an angle of 30o. A solar thermal energy system checklist that was completed for Mabie Farm Park can be found here.
Figure 1. Solar Collector location at Mabie Farm Park
Based on an annual hot water heat requirement of 6,582 kWh, a solar collector area of 11 m2 was estimated. The solar fraction was assumed to be 60% and the average system efficiency was 35% (based on a glazed flat-plate collector, located in a temperate climate and taking into account collector, line and store losses). The average daily solar irradiation values, at a tilt angle of 30o, were obtained from http://re.jrc.ec.europa.eu/pvgis/apps/radmonth.php?en=&europe . Based on these values, an estimation of the heat generated from the solar collectors on a monthly basis was made. This was compared with the hot water demand.
Graph 1. Solar Thermal Hot Water Demand and Supply
As shown in Graph 1, the hot water demand is not met during peak summer months when visitor numbers are at their highest. However, the initial estimation shows that the installation of a solar thermal system could make a substantial contribution to the heating load for hot water. The full spreadsheet can be viewed here .
To make a more detailed analysis, and to take into account the effects of hot water storage, a solar thermal simulation program is recommended.
Solar Thermal Simulation (T*Sol Pro Demo)
A number of simulation software’s were tested, with T*Sol proving to be the most useful at demo level.
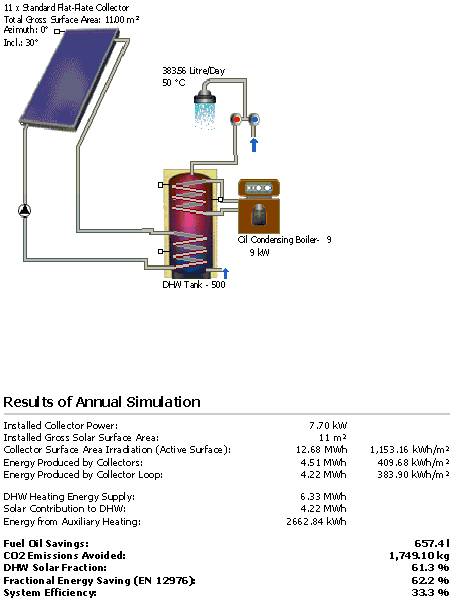
A simulation was undertaken for a standard flat-plate collector of area 11 m2 at a tilt angle of 30o. Well insulated hot water storage of 500 litres was selected (store volume should be designed to be 1 – 2 times the daily hot water consumption) and for reference purposes a 9 kW oil condensing boiler (with a 55% hot water heating efficiency related to LHV) was chosen for auxiliary heating.
The following results for an annual simulation were obtained:
Figure 2. T*Sol Solar Thermal Simulation Results
The summer camping model chosen was in order to best reflect the demand profile of Mabie Farm Park (ie. highest demand in summer). As can be seen, the collector loop produces 4.22 MWh and 2.66 MWh is provided from auxiliary heating. The results for the solar fraction and system efficiency also closely match those used in the estimation: 61.3% and 33.3% respectively.
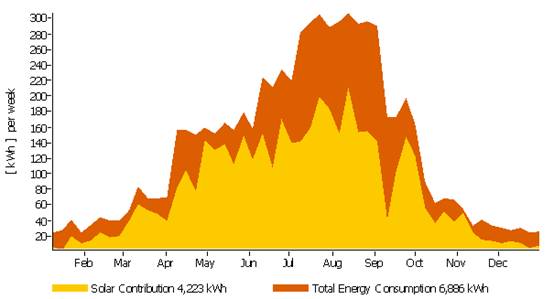
A monthly comparison of the solar thermal system contribution and the total energy consumption for hot water is shown in Graph 2.
Graph 2. T*Sol Solar Thermal Contribution and Total Energy Consumption
T*Sol Environmental and Economic Analysis
The use of the solar thermal system results in a reduction in CO2 emissions of 1,749 kg per year.
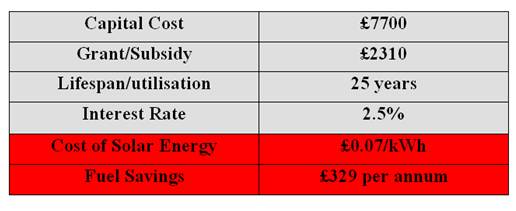
Based on a cost of £700/m2 the capital cost for the solar thermal system will be £7,700. Assuming a subsidy of 30% of the installation cost this will be reduced to £5,390. Based on a lifespan of 25 years and an interest rate on the capital of 2.5% the cost of the solar energy is £0.07/kWh. If the heating oil is assumed to cost £0.5 per litre (based on purchase of 500 litres bulk), then annual fuel oil savings of 657.4 litres will result in savings of £329 per annum.
Table 1. T*Sol Solar Thermal Economic Analysis
References
- Planning and Installing Solar Thermal Systems: A Guide for Installers, Architects and Engineers. DGS (The German Solar Energy Society), Ecofys. 2005.

| MSc: Renewable Energy Systems and the Environment | © University of Strathclyde 2010 |