Once gas backup boilers are removed from the site then all carbon emissions due to the heating system originate from the generation of electricity for the grid. Grid generation is from a mix of sources that changes continually, and the carbon emissions associated with one unit of grid electricity vary according to this mix.
Data is made publicly available for the carbon intensity of the grid both historically and in real time, calculated on the basis of the contracted supply of electricity for a half-hour period. This data, along with a generated forecast for a period based on predicted demand patterns and weather forecasts, can be downloaded from an online API api.carbonintensity.org.uk.
The different spatial patterns of demand and generation means that the carbon intensity varies regionally across the UK. Scotland, mainly due to its much higher levels of wind power, typically has 'cleaner' electricity than the south of the UK. For this reason it would be preferable to use local carbon intensity data. However, such regional data only became available from end of May 2018.
| Electricity source | Typical carbon intensity | Proportion of 2018 generation |
|---|---|---|
| Coal | 937gCO2/kWh | 5% |
| Oil | 935gCO2/kWh | 0.5% |
| Gas | 394gCO2/kWh (combined cycle) | 39.4% |
| Biomass | 120gCO2/kWh (wood) | 10.6% (all types) |
| Wind | 0gCO2/kWh | 17.1% |
| Solar PV | 0gCO2/kWh | 3.4% |
| Nuclear | 0gCO2/kWh | 19.5% |
Carbon intensities for various sources of UK grid generation (BEIS 2018[1], BEIS 2019[2])
Due to the effects on wind and solar power there is a strong correlation between this carbon intensity and the weather conditions. For this reason the complete 2018 carbon series for the UK was chosen in preference to a series based on Scotland regional data that would not have represented realistic responses to the climate.
The 2018 carbon series used in modelling is shown below. The half-hourly time series was turned into an hourly series for use in energyPRO by a straightforward averaging of the two points in the hour. The red section of the line indicates where data was missing from the reported carbon values - it is unclear what the cause of this is. Forecasted values were used to substitute for the actual values during this period.
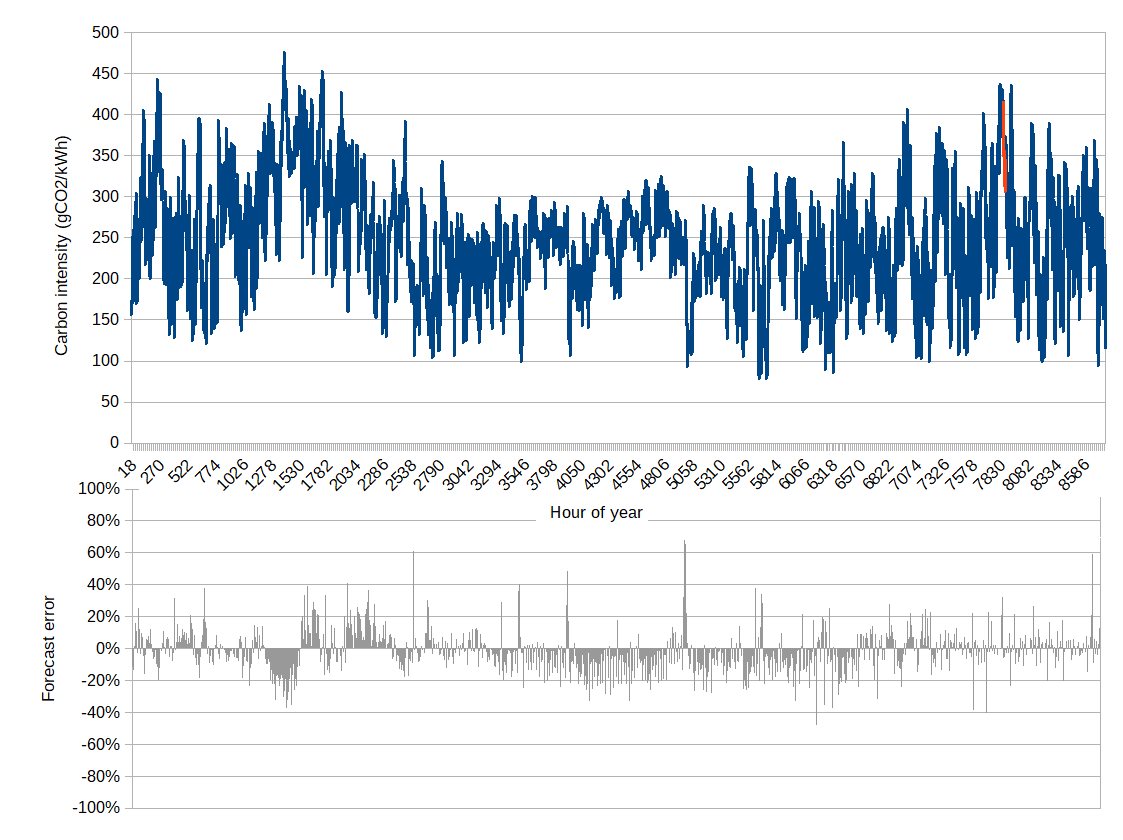
Carbon intensity data retrieved from api.carbonintensity.org.uk for 2018
The overall pattern shows a weak seasonal variation, with generally lower intensities in the summer and greater fluctuations in winter. A period of high carbon intensity associated with the "Beast from the East" can be seen around hours 1300 - 1530.
The lower graph shows the error in the forecast value over the year compared with the actual value - it can be seen that varies significantly over the year. For most of the year the errors are within +/-20% of the real-time data, but the forecast data includes some abberent values an order of magnitude different, which result in errors above 1300% - it is most likely that these are artefacts of the machine learning based forecast code rather than plausible values that were genuinely expected.
Carbon optimisation
The control logic in energyPRO by default makes decisions between multiple energy sources with the goal of minimising cost. Electricity imports can either be given a fixed price, priced by period (typically a reduced overnight price), or be created as a spot market, with prices varying hourly. This optimisation method can be repurposed to minimise carbon emissions by using the carbon intensity as a surrogate for grid electricity prices. This has the effect of changing the cashflow and other financial reports into statements of carbon accounting, with expenditure measured in kgCO2 rather than GBP.