The main problem in evaluating energy yield from wind is to obtain an accurate knowledge of what the wind resource actually is.
Unlike with large wind farms where detailed studies of the wind speed and distribution can be conducted and accurate simulations can be done, data for small wind are not available in the large majority of cases.The most basic information usually available is the average wind speed, which is largely insufficient. As we know higher wind speeds proportionally generate a lot more energy than lower wind speeds and regular sustained wind is also better.
The preferred data to obtain is hourly wind speed over a year period, this allows to get a more accurate distribution of the wind speed and conduct more accurate simulations. In our modelling work we have used hourly data measured in Glasgow and Palermo. What needs to be considered next, is the difference between the sites where wind was measured and where the turbine will be.
The hourly data we have collected were measured at 10m height at the airport, in other words in a place fairly clear of obstacles. The available wind speed data would theoretically be adequate to evaluate the energy yielded by a 10-15m high wind turbine at the same airport location. However as we wish to evaluate the energy yield for a turbine located within a private dwelling property, the data is unlikely to provide a realistic result in most cases. The main problems are the obstacles that may be present and have an impact on the wind speed. We divided dwellings into 3 categories to evaluate wind potential:
- Rural: farm type house, without major obstacles other than a few trees and no high buildings in the vicinity
- Residential: suburban style detached houses, surrounded by small gardens
- Urban: semi-detached houses or blocks close to each other
There are several parameters in HOMER which represent the type of dwelling considered
♦ The hub height - H1
♦ The anemometer height - H2
♦ A factor called 'Surface Roughness Length' which takes into account standard obstacles such as trees or buildings (SRL) The factor SRL ranges from:
SRL=0.003 (extremely smooth surface - snow)
To SRL=3 (city with high density of buildings)
Lower values correspond to off-shore locations. If H1=H2 then the value assigned to SRL is irrelevant as the wind speed flowing through the turbine is taken as the exact speed measured.If H1<H2 then the higher the SRL the smaller the amount of electricity produced.
Homer assumes the actual wind speed decreases from the value measured at the anemometer height according to the ground type. If SRL is larger then there is more obstruction to the wind and the speed at H1 will be lower, hence the smaller electricity production. If H1>H2 then the higher the SRL the larger the amount of electricity produced.
Homer assumes the wind speed increases with height as compared to the value measured at anemometer H2.
In fact, for a given anemometer height and corresponding wind profile measured, if SRL is higher it means the wind at higher height must be stronger than if SRL is smaller. We now look at different cases:
Rural We have also set the height of the anemometer at 10m and the hub at 10m, in other words: H1 = H2 = 10m
This corresponds to typical rural landscape near Glasgow which is relatively flat and therefore assuming the turbine is installed properly the speed measured should be representative of the area.
Suburban We have set the WSE = 1.5
We have also set the anemometer height at 15m and the hub at 11m.
Because of the buildings and trees present in the area we estimated that the wind speed at 10m is less than at the airport and that the same wind speed could only be found above 5m.
The hub is set at 11m to be at the proper height above most buildings and trees
Urban We have set the SRL = 3
We have also set the anemometer height at 15m and the hub at 11m.
Because of the buildings and trees present in the area we estimated that the wind speed at 10m is less than at the airport and that the same wind speed could only be found above 5m.
The hub is set at 11m to be at the proper height above most buildings and trees
Results
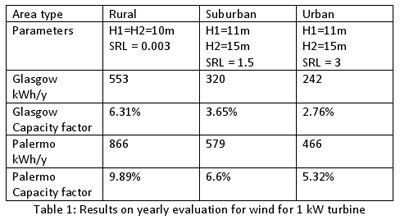
The average wind speeds measured are:
Glasgow: 3.9 m/s
Palermo: 3.8 m/s We note that Palermo is better despite a lower average wind speed. This is because the distribution of the wind speed is different (see Homer file). The wind in Palermo reaches higher speeds for longer periods as compared to the wind in Glasgow and because energy produced is proportional to the cube of the speed - the higher wind speeds contribute more to overall production yearly.
Financial analysis
In the financial analysis we have to consider several parameters:
- The net investment cost, which depends on
◊ The equipment and installation cost
◊ Grants applicable
◊ The loan terms (interest rate and duration)
- The yearly maintenance cost (O&M) expressed as a percentage of the equipment costs
- The value of the electricity produced
Yearly cost: The net investment cost and maintenance will be compiled into a yearly cost for the duration of the loan. The duration of the loan is set at what would be a reasonable lifetime for the equipmentRevenue obtained assuming all electricity produced is sold at a given value. The value of the electricity produced will depend on whether there are feed-in tariffs
The feed-in tariffs in the UK for wind are:
◊ Up to 1.5kW --> 34.5 p/kWh
◊ From 1.5kW to 15kW --> 26.7 p/kWh There are no feed-in tariffs for wind in Italy. As these tariffs will not last forever and are expected to decrease, we will look at financial viability for electricity value from average grid price to highest feed-in tariff. Net revenue: this is the revenue minus the yearly cost
♦ Financial analysis for a 1kW wind with the following parameters:
◊ Equipment cost = £4000
◊ O&M = 1% per year (we consider this number as low and based upon the best available equipment)
◊ Loan interest = 2.5%
◊ Loan duration = 20 years From this analysis, we obtain the following graph for which:
· Each colour represents a different electricity price in £.
· In blue is the grid price.
· In yellow and purple are the feed-in tariffs.
· The vertical scale represents the net yearly income (revenue - yearly cost) for the duration of the loan until final repayment
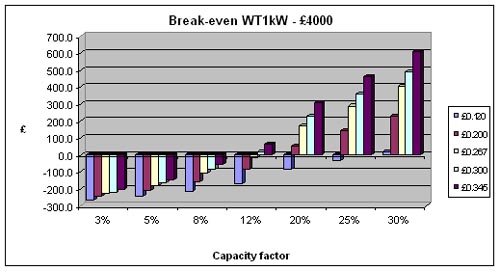
Basically a positive number means that the wind turbine yields more income than it costs for the 20 years loan period. We see that without feed-in tariffs the turbine is profitable only if the capacity factor reached close to 30%.
While this is not impossible to obtain, it will only occur in a location where 2 conditions are met:
- High average wind speed
- The yearly maintenance cost (O&M) expressed as a percentage of the equipment costs
- Perfect site situation (no obstruction)
Such sites are not very common in Europe, or even in UK apart from the north of Scotland. We can therefore conclude that under these conditions feed-in tariffs are required (but not necessarily sufficient) to make small wind viable.Using the highest £0.345 UK feed-in tariff we see that the minimum capacity factor required is about 10 or 11% to break even. Based upon our simulation results such capacity factor was never obtained in Glasgow even for the rural areas.
Possibly some rural sites near Glasgow may benefit from higher average wind speed than 3.9 m/s and would yield a capacity factor over 11%, however overall these would represent a very small minority of dwellings. In Palermo rural the capacity factor is not far from 11% but there are no feed-in tariffs.
How could small wind be viable in the UK? As the wind resource cannot be changed and the feed-in tariffs are rather high already, we can only look at 2 separate parameters to see whether small wind can become viable:
a) A lower investment cost
b) A longer lifetime of the equipment
Influence of equipment cost We now simulate what we consider could be a best case scenario.
We have a lower equipment cost of £2000 and a loan rate of 0.5%.
This would correspond to a grant of about 50% of capital cost and a nearly interest free loan (which are available for certain renewable energy sources in certain European countries)
We have kept an average yearly O&M cost of 1% which we believe is rather low already.
We obtained the graph below:
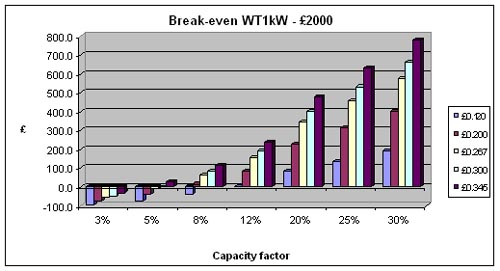
Based upon the highest UK feed-in tariff we see that we require a capacity factor of about 4%. Based upon our simulation results it would be feasible to obtain this capacity factor in suburban areas for either Glasgow or Palermo.
We do not believe it would make it still in urban areas.
The graph shows results for 1kW turbine costing £2000 which may be regarded as a very optimistic assumption; it may be easier to reach a price of £2000/kW for a larger turbine (10kW or 15kW) as they cost less on a per kW basis and therefore a smaller grant may be needed in proportion. However, the feed-in tariff would then drop to £0.267 and the capacity factor needed is about 5%.
We think that this could apply to a limited amount of dwellings in suburban areas or a majority of rural dwelling benefiting from the same wind speed climate data. We should also consider that the turbine, after 20 years of operation, would yield energy at a very low cost (O&M only). A longer lifetime of the equipment We will now look at simulation results based on the assumption that the lifetime is longer. We now model the same 1kW turbine using:
◊ Cost of £3000 (This reflects a moderate grant or a lower future equipment cost)
◊ O&M = 1% yearly
◊ Loan interest = 2.5%
◊ Lifetime and loan duration = 30 years
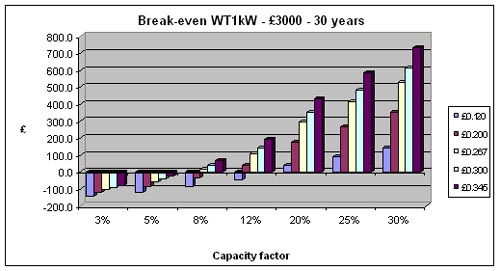
Using the highest feed-in tariff we see that the capacity factor required is just over 5%. We believe this might work for some suburban locations in Glasgow or for most rural locations nearby.
To summarise the results:
- Small wind is not viable in urban areas in Glasgow (or Palermo) even with high financial incentives
- Small wind could be viable in Glasgow (or Palermo) suburban areas, but this would require having at the same time:
- The current high feed-in tariff of £0.345/kWh
- The yearly maintenance cost (O&M) expressed as a percentage of the equipment costs
- Installed cost of £2000/kW (either through a grant or other form of price reduction)
- A minimum lifetime of 20 years
- Small wind can be viable in rural areas near Glasgow (or Palermo) assuming we have:
- The current medium feed-in tariff of £0.267/kWh
- Installed cost of £2000/kW (either through a grant or other form of price reduction)
- A minimum lifetime of 20 years
- Wind resource in Palermo is better than Glasgow despite lower average yearly wind speed. This is due to a better distribution of the speed.
Conclusion
The results obtained show rather low energy yield from wind in either location. The capacity factors we have obtained are acceptable in rural areas, quite low in suburban areas and they are very low in urban areas. It is true that certain sites in rural areas could potentially yield better results due to a better location under the same wind speed profile, however these cases will be limited. On the other hand dwellings in a rural clear environment represent a minority of the dwellings concerned in this study, therefore we should focus on what happens for urban and suburban areas.Results obtained from simulations for urban environment show very low capacity factors, even with financial incentives.
|