Introduction
The case study has been created as part of the research in order to evaluate the importance and practicality of using XL monopiles for offshore wind turbine substructures. Preliminary structural design has been made to analyse the behaviour of supporting structures for two different turbines: Vestas V112-3.3MW and V164-8.0MW constructed at various water depths.
The analysis has been undertaken for:
The analysis aims to examine all of the structures under identical conditions in order to obtain analogue results. Preliminary design includes tuning the structures to the required frequency window and serviceability limit state check. The results from the case study include weights of the structures in all the analysed scenarios which then have been used for the financial part of the project. Finally, conclusions about the structural issues and the implications of usage of XL monopiles have also been stated.
Assumptions
Load
Offshore wind turbines are subjected to many different kinds of loads, which can be divided into (BS EN 61400-3:2009):
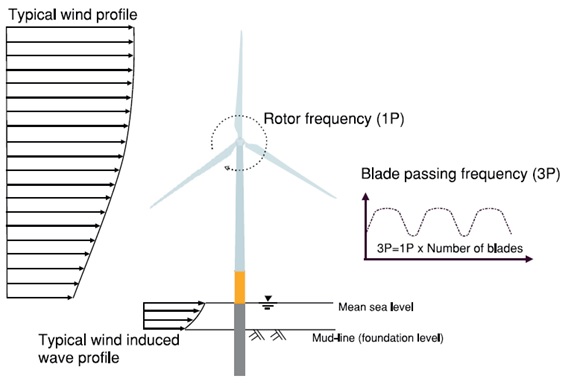
Figure 2. Main external loads acting on offshore wind turbine (Lombardi, D. et al, 2013).
For the purposes of this project only dead loads, wind load and wave load have been taken into account as they are thought to be the most significant loads acting on the whole structure and also to maintain the transparency and simplicity of the analysis.
Dead load
Dead loads considered in the analysis are:
Table 1. Self-weight of wind turbines and supporting towers.
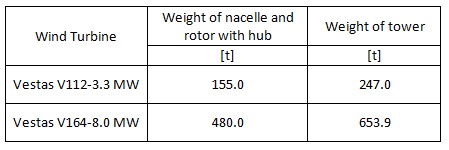
The weight of the nacelles, rotors and hubs have been taken directly from information provided by the producer of the wind turbines (Vestas Wind Systems A/S. 2013). The assumptions of dimensions and weights of the tapered towers have been based on research performed on the existing structures and literature, which then have been analysed and revised appropriately. At this point the importance of the assessment of the turbine weight (rotor, hub and nacelle) should be emphasized. Its self-weight is a significant load for the supporting structure. What is more, it is located at the very top of approx. 100m high tower. All these aspects affect the dynamics of the wind turbine. The dynamic model of the wind turbine is shown in Figure 3.
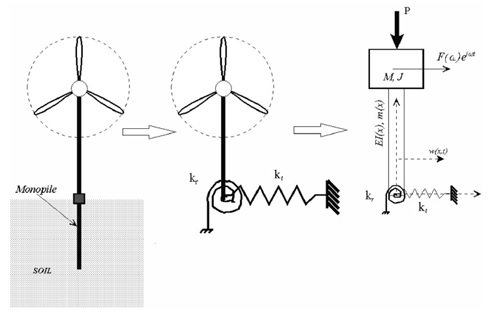
Figure 3. Wind turbine on monopile foundation and its mathematical model (Bhattacharya S. and Adhikari S., 2011).
The natural frequencies of the structure are dependent on inter alia mass matrix of the structure. Generally speaking, the greater mass at the top of the structure and the more slender the structure itself, the lower first natural frequency, thus it gets closer to the forcing frequencies of the wind and waves and the risk of occurrence of resonance is higher (Sparrevik, P., 2014).
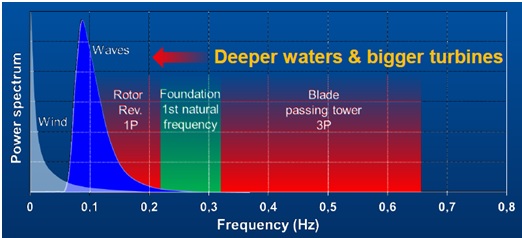
Figure 4. Frequencies of external loads and the structure of wind turbine (Sparrevik, P., 2014).
The resonance phenomenon may occur if the natural frequency is close to any of the forcing frequencies. In resonance, the oscillation amplitude is at its maximum (Figure 5), which in practise may cause greater internal forces in the structure and consequently lead to the collapse (Tempel, J. van der and Molenaar, D.P., 2002).
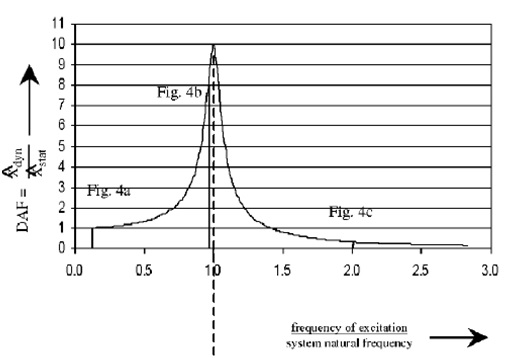
Figure 5. Frequency response function. (Tempel, J. van der and Molenaar, D.P, 2002).
More on tuning of the analysed structures can be found in Natural frequency assessment and Analysis section.
Wind load
Wind load acting on the wind turbine is an aerodynamic load which is dependent on many variables such as wind speed or aerodynamic shape of the structure. Particular attention should be paid to the lateral wind forces acting on the rotor of the turbine — thrust force. Assessment of thrust force is a crucial step in analysis of wind turbine structure, because it is located at the hub level and therefore it gives a great value of the bending moment in the foundation. In order to calculate the values of thrust for the particular wind turbines, power curves and wind theory have been used. Power extracted by the wind turbine can be calculated as (Spera, D.A. ed., 2009):
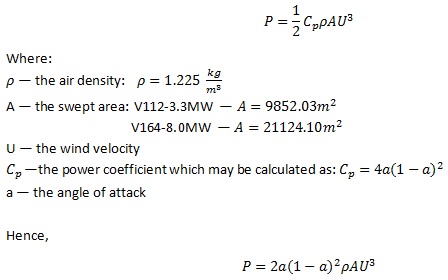
Having power curves (Vestas Wind Systems A/S. 2013) the angle of attack at each wind speed can be extracted.
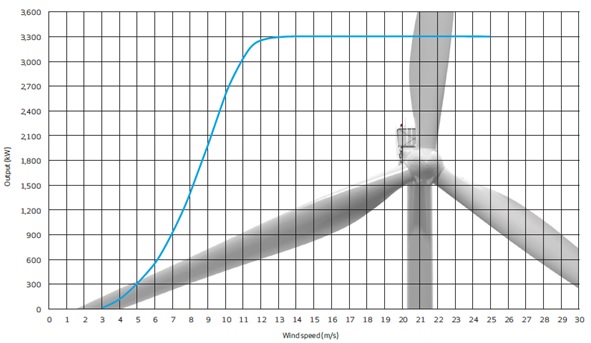
Figure 6. Power curve for Vestas V112-3.3MW (Vestas Wind Systems A/S. 2013).
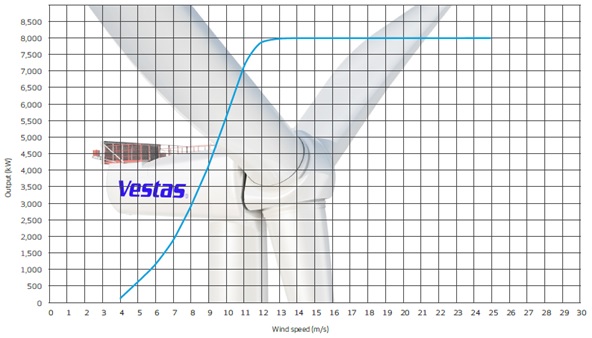
Figure 7. Power curve for Vestas V164-8.0MW (Vestas Wind Systems A/S. 2013).
Thrust coefficient can be calculated as (Barltrop, N., 2015):
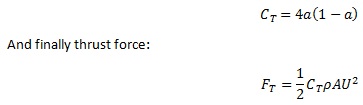
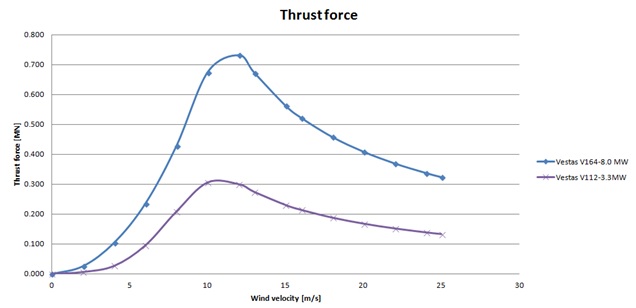
Figure 8. Thrust forces at various wind speeds.
In the analysis only the maximal values of thrust were used i.e.
V112-3.3MW — F=305kN
V164-8.0MW — F=730kN
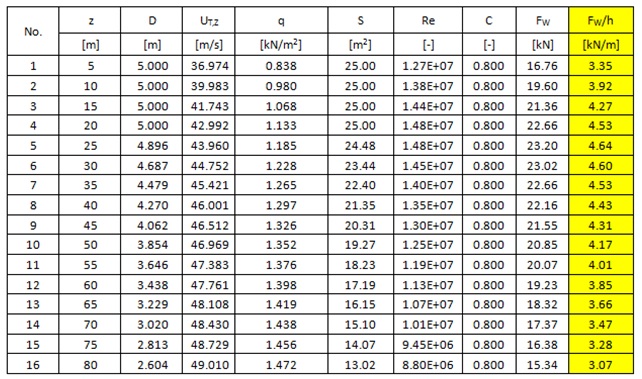
Wind load acting on the tower has been calculated according to DNV-RP-C205 Recommended Practice, 2010. Wind force on a structural member:
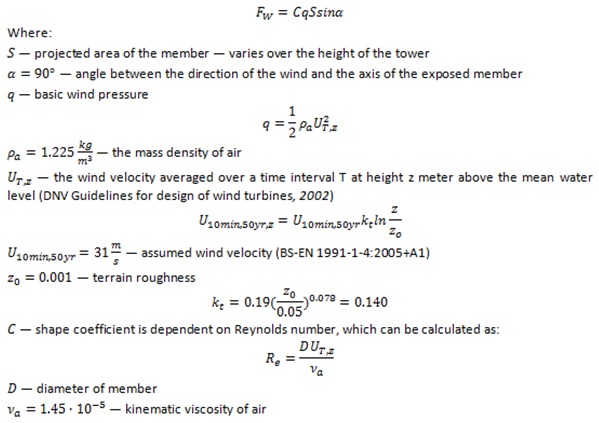
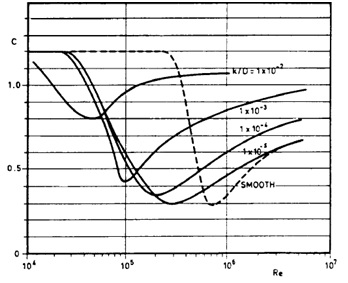
Figure 9. Shape coefficient for fixed circular cylinders (DNV-RP-C205 Recommended Practice, 2010).
Table 2. Calculation of wind load for 3.3MW turbine according to DNV-RP-C205 Recommended Practice and DNV Guidelines for design of wind turbines.
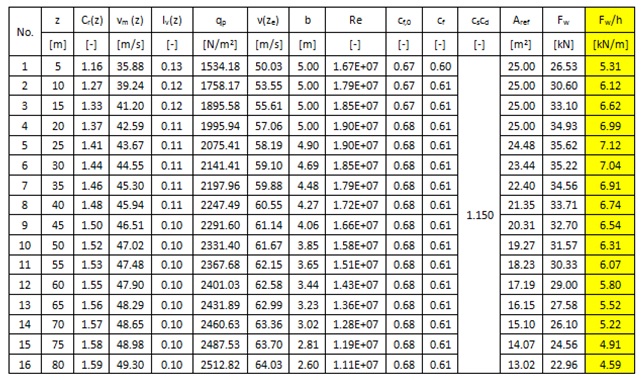
The procedure above does not take into consideration the dynamic behaviour of the structure. The assumption for the procedure is that the cylinder is a fixed structure, thus wind load is much underestimated. In order to estimate the more accurate wind load the full procedure from BS-EN 1991-1-4:2005+A1 has been adopted.
Table 3. Calculation of wind load for 3.3MW turbine according to BS-EN 1991-1-4:2005+A1.
Wave load
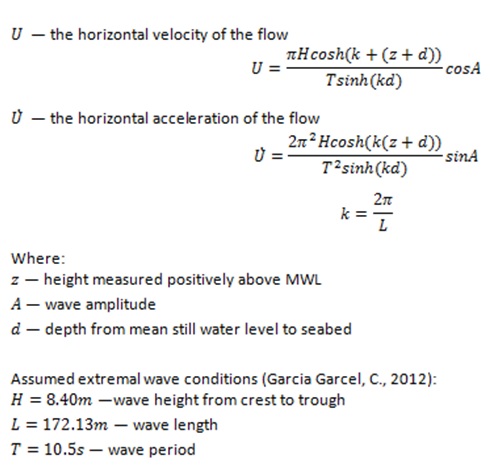
Waves crushing against the structure cause internal forces within the structure. In order to calculate wave load acting on the monopile linear wave theory has been used. BS-EN 61400-3:2009 standard recommends Morison’s equation to calculate viscous drag and inertia loading.
Morison’s equation can be expressed as:
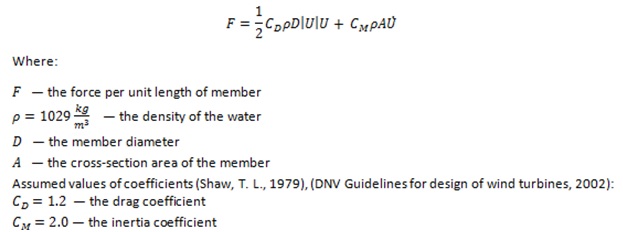
Linear wave theory results (Barltrop, N., 2015):
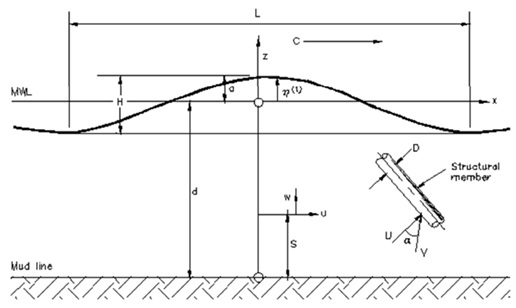
Figure 10. Regular wave — notation (Barltrop, N., 2015).
Wave loads for different water depths were calculated using Mathcad spreadsheets. The variables for different cases were:
Wave load is also dependent on the wave amplitude. In order to calculate the maximal wave load the optimal amplitude for each scenario should be computed e.g. by using a solver tool.
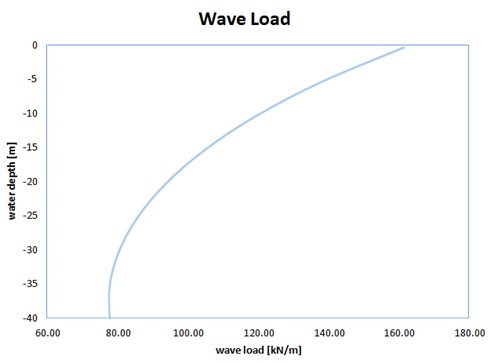
Figure 11. Example of wave load — monopile φ8m at 40m water depth.
Natural frequency assessment
As it was already mentioned, the assessment of the first natural frequency of the offshore wind turbine is a very important part of structural analysis. The forcing frequencies that should be taken into account are:
Wave and wind loads are cyclic, dynamic loads whose frequency spectra can be measured and treated statistically. Those frequencies are quite low (Pierson & Moskowitz wave spectrum — peak at approx. 0.1Hz), thus they are not considered to be as troublesome as the frequencies of rotor operation. The vibrations of the hub are caused by mass and aerodynamic imbalance of rotor, thus the frequencies of these loads are related to the operational speeds of the rotor — referred as a the lowest and the highest operational intervals —1P lower and 1P upper. Blade shadowing effect — 2P/3P — should also be taken into consideration. A single blade passing the tower causes reduction of the wind load on the tower, hence additional cyclic load on the structure at the frequency equal to 1P x number of blades. The typical frequency spectra of dynamic loads is shown in Figure 12. (Bhattacharya, S., 2014)
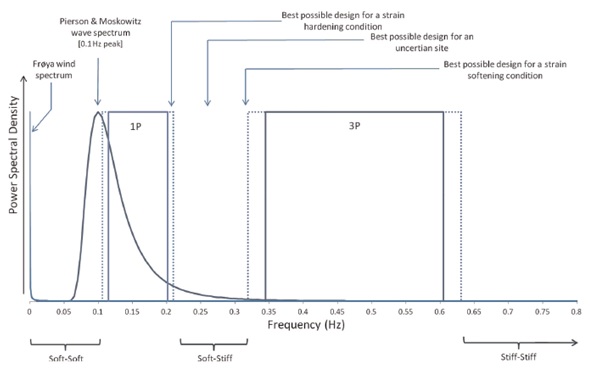
Figure 12. Example of frequency spectra of the dynamic loads acting on the wind turbine (Bhattacharya, S., 2014).
All the above indicate the existing constrains on the first natural frequency of the structure. There are three types of design in terms of first natural frequency (Figure 12):
What is more, in order to avoid the resonance phenomenon it is recommended to avoid a 10% zone on either side of the forcing frequencies (DNV Guidelines for design of wind turbines, 2002).
Taking into account the constrains above, wind and wave spectra and operational speeds of V112-3.3MW and V164-8.0MW wind turbines provided by the producer (Vestas Wind Systems A/S. 2013) frequency spectra for both turbines have been plotted.
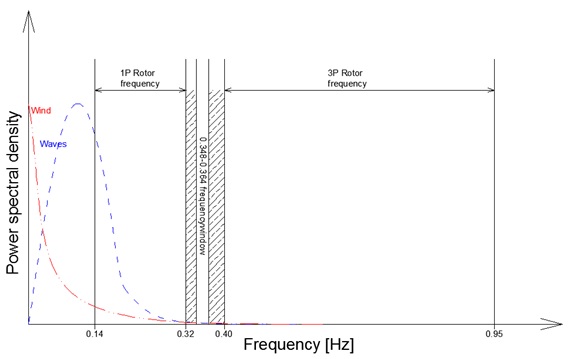
Figure 13. Frequency spectra of the dynamic loads acting on V112-3.3MW turbine.
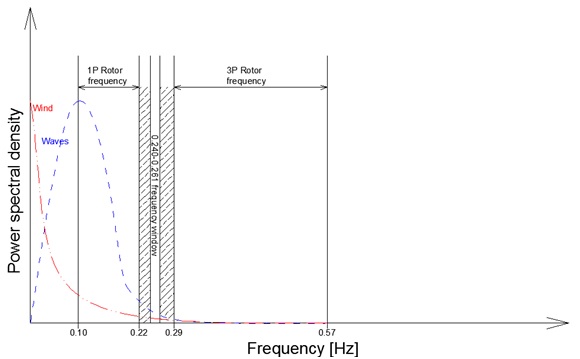
Figure 14. Frequency spectra of the dynamic loads acting on V164-8.0MW turbine.
Soil conditions
Assumed soil strata:
Influence of each load on supporting structure
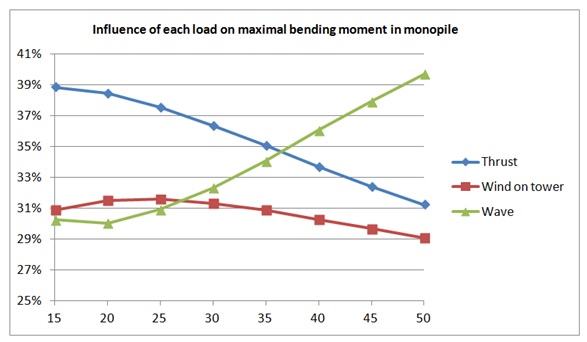
Figure 15. Influence of each load on maximal bending moment in XL monopile for 8MW turbine.
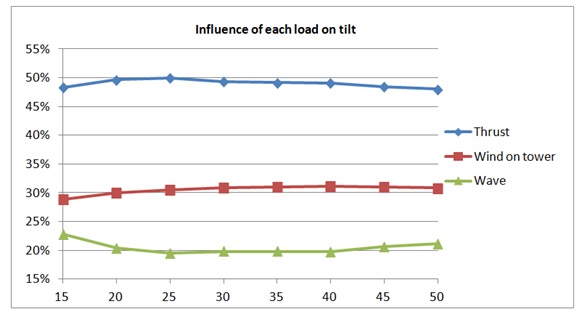
Figure 16. Influence of each load on tilt of the tower for 8MW turbine.
Analysis
For the purposes of this project 2D FEM models have been used in order to analyse the behaviour of the supporting structures for Vestas V112-3.3MW and V164-8.0MW constructed at various water depths. The analysis aims to examine both structures under identical conditions in order to obtain analogue results. Preliminary design includes tuning the structures to the required frequency window and serviceability limit state check.
Approach adopted:
- assumptions based on research and literature have been made in order to determinate the initial dimensions of the structure
- assumptions of the soil strata in order to determine the shear resistance of soil against the horizontal displacement (Winkler Approach)
- calculation of loads for given wind and wave conditions, which depend on dimensions of the structure
- tuning the structure to the required first natural frequency:
- the ratio of wall thickness to the diameter of the pile t/D is kept constant and is equal to 1/80, which is thought to be a good estimation
- the required frequency of the structure is achieved by lengthening the embedment of the pile
- at greater water depths lengthening the embedment stops giving satisfactory results, thus the ratio t/D must also be increased
- serviceability limit state (SLS) is checked for the following characteristic combinations:
- wind load (return period of 50 years) “+” wave load (return period of 5 years)
- wind load (return period of 5 years) “+” wave load (return period of 50 years)
-
SLS includes:
- the limit for the permanent accumulated rotation at the seabed — 0.25° (DNV-OS-J101, 2011)
- the maximum allowable tilt under characteristic loading is 0.50° from vertical (DNV Guidelines for design of wind turbines, 2002)
- the maximum pile toe deflection ±20mm (Krolis, V.D., Zwaag, G.L van der and Vries W. de, 2009)
The analysis has been undertaken for (Figure 17):
- Vestas V112-3.3MW — 6 and 7m-diameter monopiles
- Vestas V164-8.0MW — 8 and 9m-diameter monopiles (which are currently thought to be XL monopiles)
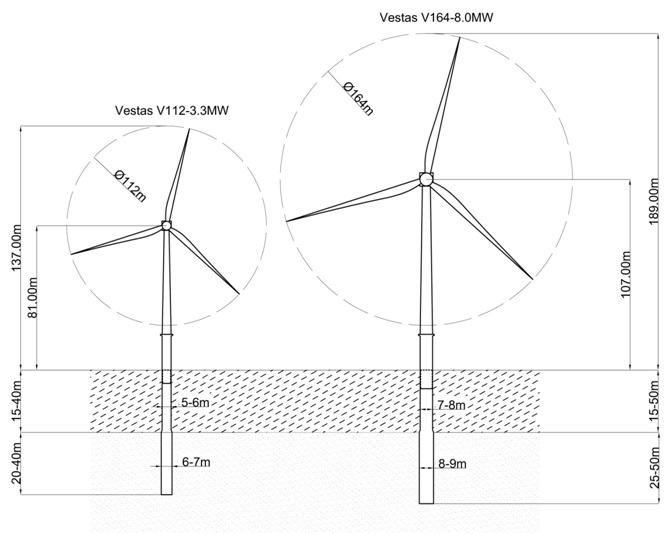
Figure 17. Overview of the analysed scenarios.
Table 4. Sample results of obtained weight of XL monopiles for V164-8.0 MW wind turbine.
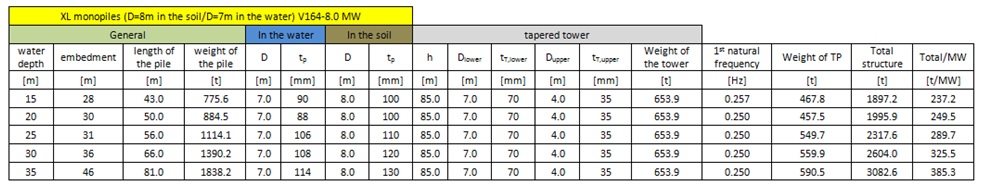
Table 5. Summary of analysed scenarios.
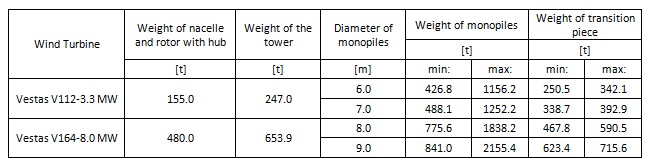
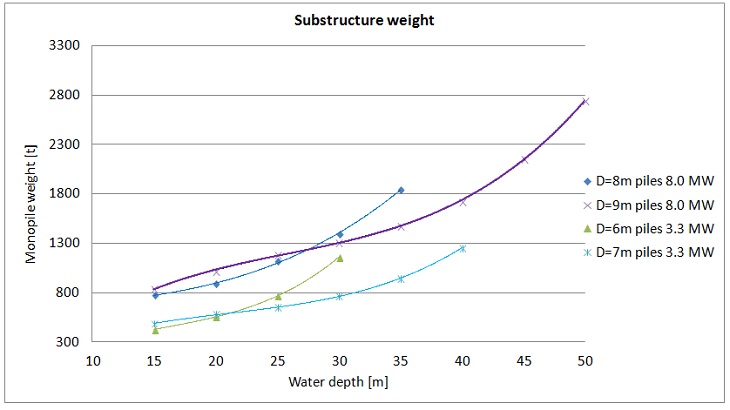
Figure 18. Weight of monopiles at various water depths.
The diagram above shows how weight of the monopiles changes at various water depths. The obtained trends are similar for both wind turbines. Weight of monopiles increases at greater water depths but this correlation is nonlinear. At relatively shallow waters the slopes of the curves are small but at greater water depths the weight increase is more significant. This indicates that at that points the change of the diameter of the monopile to a larger one may be more economical. For a particular wind turbine, the smaller diameter of the monopile is a better choice at shallow water but there is a point that it gets heavier than a larger diameter monopile. The reason of that phenomenon is the fact that greater embedment is needed for smaller diameter piles and sometimes also the wall thickness.
The diagram above also shows that monopiles supporting 8MW Vestas turbine are heavier, which is quite an obvious conclusion but a more reasonable comparison is the weight of the whole structure per MW of rated power of the wind turbine.
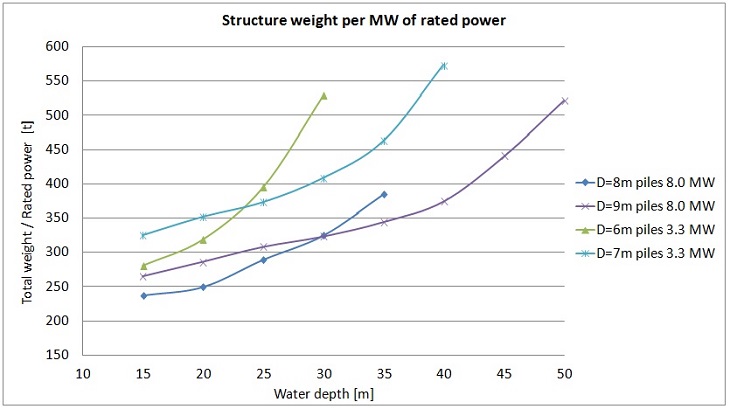
Figure 19. Weight of the whole structure per MW of rated power.
The diagram indicates that in terms of weight of the structure per MW of its rated power it is more favourable to use higher capacity wind turbines. It also means that the differences in weight of the structures for both turbines are smaller than the ratio of their rated power (8MW/3.3MW).
Taking into account all the above, the diagram of the minimum weight of the structure per MW of rated power can be plotted. It combines diagrams for both diameters for each wind turbine — which in practise means the selection of a smaller diameter pile at shallow water and a larger one at greater depths. The diagram in Figure 20 shows that for two different turbines the same weight per MW is achieved at different water depths e.g. for 3.3MW turbine a ratio equal to 400 t/MW is achieved at 29m water depth. The same ratio for 8MW turbine is achieved at 42m. That means that usage of 8MW wind turbines may be practicable even at greater water depth than 3.3MW turbines.
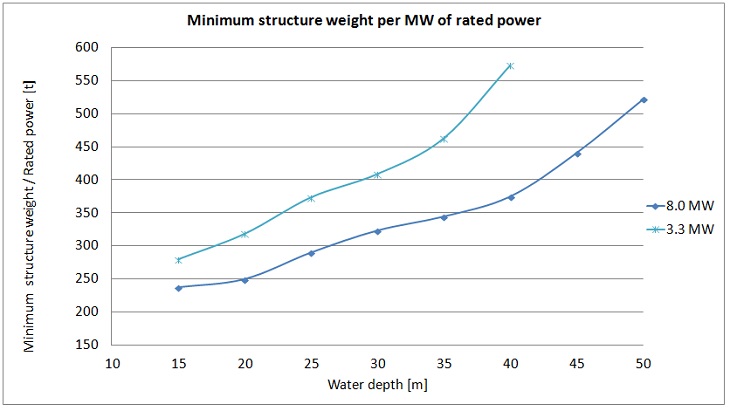
Figure 20. The lowest ratio of weight of the structure per MW of rated power.
Last but not least, the obtained length of monopiles can also be compared. For both wind turbines the required length of the piles is shorter for larger pile diameters. For smaller diameters greater embedment is needed to reach the required first natural frequency, limit the displacements of the structure and also to fulfil further ultimate limit state requirements. Initially the analysis of 8MW wind turbine has also been undertaken for a 7m diameter pile, but even at 15m water depth the piles have been considered to be too long. That means that in this scenario this specific diameter was inadequate.
The selection of a greater diamater pile may be a much more profitable option in terms of costs, simplicity and the risks that are associated with transport and installation of relatively shorter monopiles.
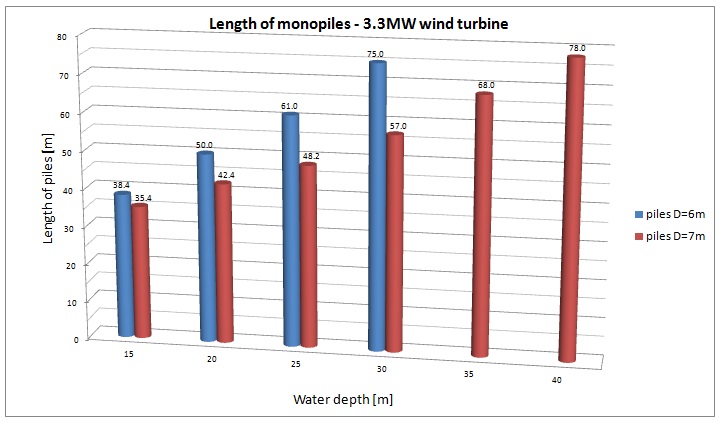
Figure 21. Length of the piles for 3.3MW wind turbine.
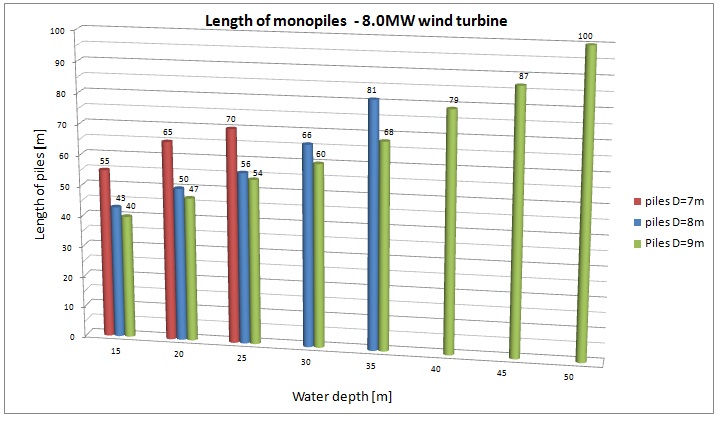
Figure 22. Length of piles for 8.0MW turbine.
Results
The conclusions above are only a brief summary of the analysis. The usage of greater diameter piles has some issues and some additional implications, which are described in Further Conclusions section.
Further Conclusions
XL monopiles are necessary to use newly developed and future wind turbines. The usage of XL monopiles as substructures may be profitable even at greater water depths. So far jackets have been used at water depths greater than approx. 35m and for wind turbines up to 5MW of rated power. The most important reason for that is the fact that it is easier to achieve high natural frequency using jackets than monopiles, which makes a big difference at greater water depths. But the operational frequencies of high capacity offshore wind turbines are different and therefore the required first natural frequency is much lower. Thanks to that fact the supporting structures may be less stiff and consequently more economical even at greater water depths. Furthermore, the usage of high capacity wind turbines and therefore XL monopiles has some additional structural implications and issues that will be briefly tackled in this section.
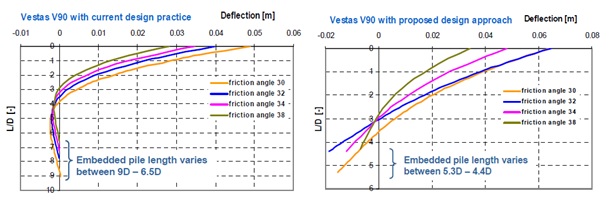
Figure 23. The lateral deflections for different embedment lengths (Krolis, V.D., Zwaag, G.L van der and Vries W. de, 2009).
Figure 24. Towers with spirals to break up vortices — Baltic 2 wind farm (EnBW).