Introduction
The cost analysis has been based on results derived from the structural analysis. XL monopile technology has been assessed financially in relation to the usage of two different wind turbines (Vestas V112-3.3MW and V164-8.0MW), employed in a 500 MW offshore wind farm. The financial analysis examines 7 different wind farm sites, with wind conditions and water depths directly related to phase 3 offshore wind farms sites in the UK. The purpose of the study is a research of the profitability of offshore wind farm developments in terms of usage of XL monopile foundations. A discounted cash flow analysis for 25 years, for the above-mentioned sites has been conducted in order to identify the LCOE (Levelised Cost Of Energy) per MWh in each scenario. LCOE has been used as a measure of viability of the technology.
Methodology
Deployment Sites
The cost of offshore wind energy is directly related to the characteristics of the wind farm site in terms of water depth, wind speed, distance from the shore and geotechnical characteristics of the seabed. This study has been based on 7 generic sites, which cover the wind farm sites that are likely to be developed during the next decade in the UK. The characteristics of the sites are demonstrated in Table 6.
Table 6. Generic deployment sites

The majority of currently planned wind farm sites is located in the North Sea. The deployment sites A-F, shown above, match the closest to the shore wind farms in the North Sea, which dominate the bulk of the currently approved projects (preconstruction stage). Site G, represents the characteristics of the further to shore projects that are currently at the consent evaluation or consent application stage and will be fully operational during the next decade (UK, 2013).
Turbines
Two different wind turbines have been used: Vestas V112-3.3 MW and V164-8.0MW. The annual energy production for each of the examined turbines has been approximated with the following equations based on the annual energy production curves given by the manufacturer (Vestas Wind Systems A/S. 2013):
Average energy production V112-3.3MW = 2.406xAnnual average wind speed – 7.18 (MWh)
Average energy production V164-8.0MW = 5.340xAnnual average wind speed– 12.43 (MWh)
The equations are valid for 100% wind turbine availability, 0% losses, k factor=2, standard air density = 1.225, and wind speed at hub height.
Global Assumptions
The capital expenditure (CAPEX) of a wind farm includes all one-time expenditure associated with wind farm development, deployment and commissioning up to the point of issue of a takeover certificate. The operational expenditure (OPEX) includes all expenditure related to the wind farm which occurs right after the takeover point, whether one-time or recurring, and it is measured on an annual basis. Expenses that are inherent to the operation of the operators business, but not directly related to the operation and management of the wind farm, are excluded (Board, 2010).
Offshore wind farm developments are capital-intensive projects with income accumulation over a number of years. In order to examine the long term potential of a project, costs at different stages of the life cycle of the farm have been considered. The risk associated with these costs becomes then an integral factor of the cost evaluation process.
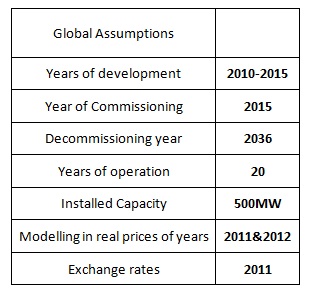
The comparison of the wind farm performance and the evaluation of the potential economic benefits from using XL monopiles at each of the described sites has been performed. In a life cycle cost analysis (LCCA) CAPEX, OPEX, decommissioning stage and energy production of each wind farm have been taken into account. The global assumptions of the analysis are listed below:
Table 7. Global Assumptions
Technical Assumptions
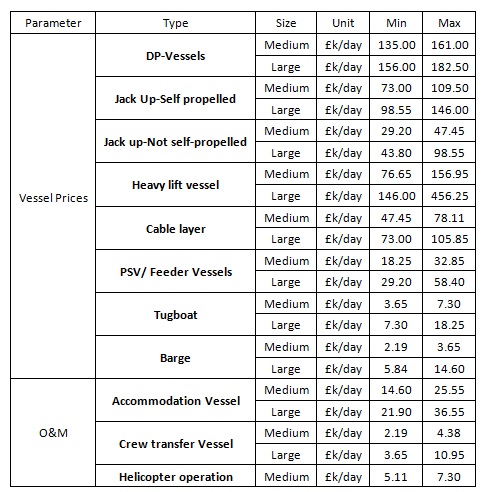
The technical assumptions that have been used in this study are detailed in the tables below.
Table 8. Substructure and Installation
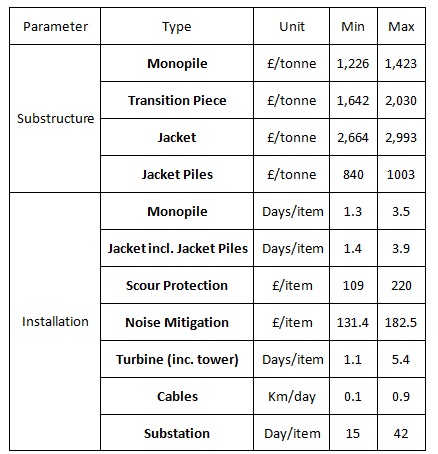
Table 9. Installation and O&M assumptions
Source of data
A number of sources has been used in order to estimate the wind farm costs in UK and Europe. The main sources of information correlating to our specific site conditions are:
The sources are considered to be highly accurate regarding the breakdown of costs, as they were performed with the collaboration of several companies and the government. The purpose of these studies was to identify the LCOE at specific and generic sites and the cost reduction opportunities.
The above mentioned data sources and results form the structural analysis have been applied to the developed models.
Levelised cost of energy
The calculation of LCOE allows to compare the costs of energy generation (£/MWh). It is a comprehensive way to compare and evaluate seven different sites for two different wind turbines.
LCOE has been calculated as follows:
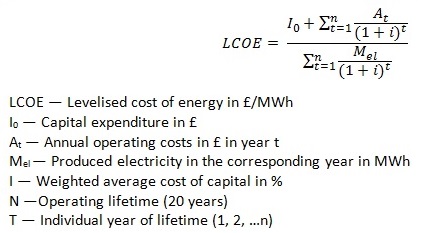
LCOE is defined as the sum of the discounted generation costs (£) over the lifetime electricity output (MWh). The levelised cost of energy is not equivalent to the feed in tariffs or the strike price. It is a measure of real cost (without inflation). The discount rate that has been used in the analysis, is the weighted average cost of capital (WACC) over the lifetime of the project (Estate, 2011).
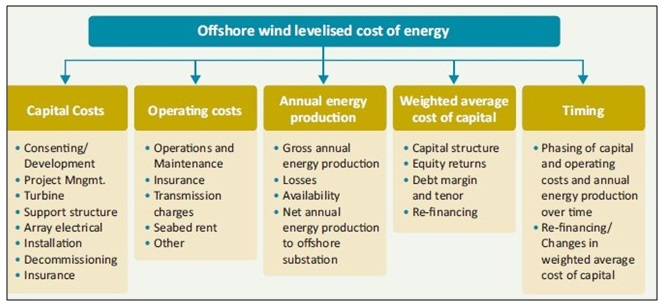
Figure 25. LCOE breakdown for a specific site (Estate, 2011)
Capital expenditure (CAPEX)
The capital expenditure cost for a typical wind farm has been calculated taking into account the following parameters:
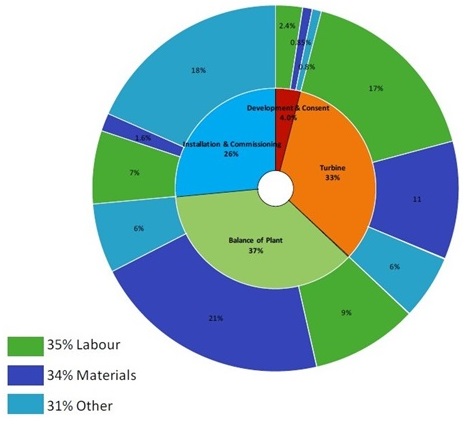
Figure 26. Typical CAPEX Breakdown (Board, 2010).
CAPEX has been calculated using eight parameters mentioned above, for 7 different sites at various water depths ranging from 15m to 40m. The breakdown of CAPEX costs (after discounting) per site, using monopiles as substructure and two different turbine types is shown below:
Table 10. CAPEX Breakdown 3.3MW turbines scenarios
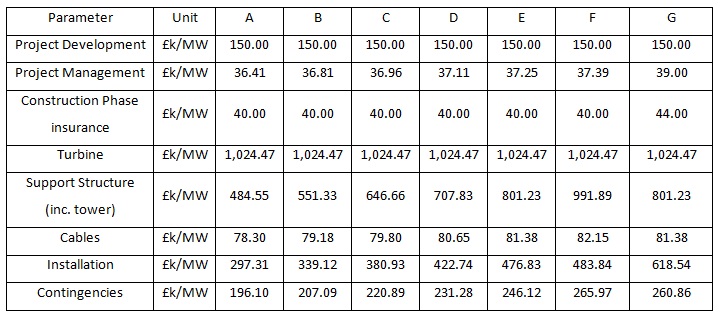
Table 11. CAPEX Breakdown 8.0MW turbines scenarios
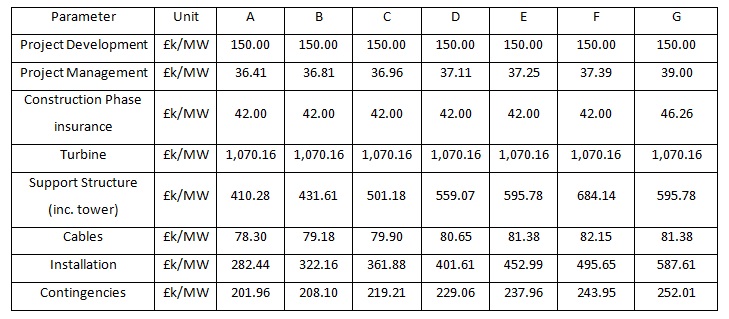
CAPEX breakdown has indicated that CAPEX costs account for approximately 60% of the overall wind farm costs. The governing parameters in CAPEX breakdown and their average contribution are presented in the diagrams below. The main parameters are cost of the turbine, the structure and installation.
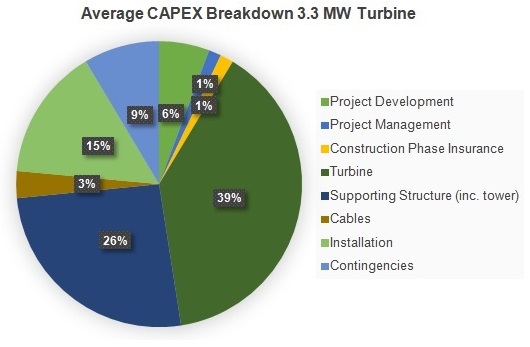
Figure 27. Average CAPEX Breakdown 3.3 MW turbine
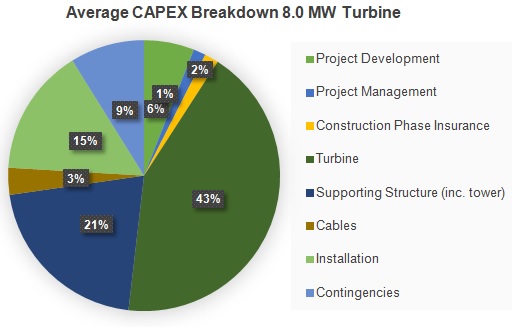
Figure 28. Average CAPEX Breakdown 8.0 MW turbine
The total CAPEX costs in two examined scenarios (3.3MW and 8.0MW turbines), in million £ (after discounting), is shown in the graph below (40 km from shore sites).
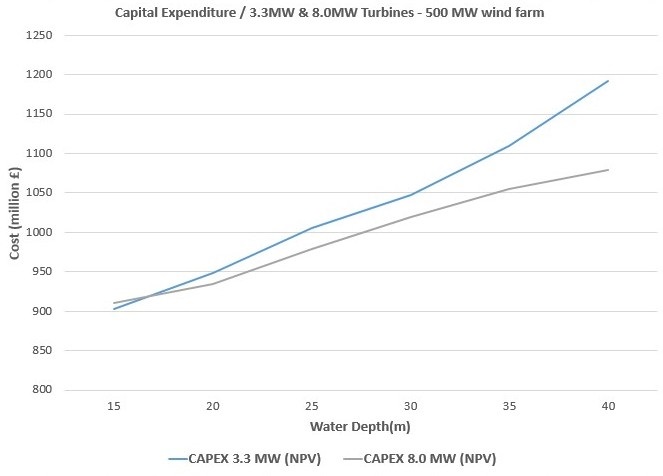
Figure 29. Total CAPEX 3.3MW & 8.0MW sites
The diagram indicates that CAPEX for 8.0MW turbines scenarios is lower at most of the water depths, in comparison to CAPEX of the 3.3MW scenarios at the same depths.
The result is what anticipated, as the usage of 8.0MW turbines reduces significantly the weight of supporting structure per MW of rated power of a single wind turbine, which has been derived from structural analysis.
Operational expenditure (OPEX)
OPEX cost for all scenarios has been calculated taking into account the following parameters:
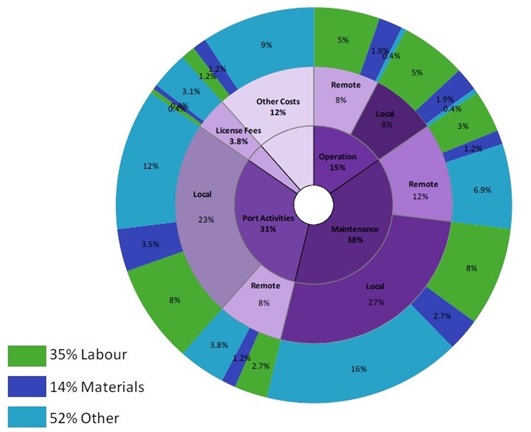
Figure 30. Typical OPEX Breakdown (Board, 2010)
OPEX has been calculated using three parameters mentioned above, for 7 different sites at various water depths, ranging from 15m to 40m. The breakdown of OPEX costs (after discounting) per site, using monopiles as substructure and two different turbine types is shown below.
Table 12. OPEX Breakdown 3.3MW turbines scenarios

Table 13. OPEX Breakdown 8.0MW turbines scenarios

OPEX breakdown has indicated that OPEX costs account for approximately 38%-39% of the overall wind farm costs. The governing parameters in OPEX breakdown and their average contribution are presented in the diagrams below. The main parameters influencing OPEX are the O&M (Operation & Maintenance) cost and the transmission charges.
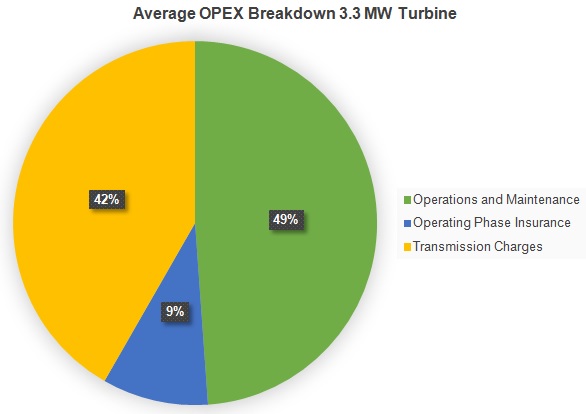
Figure 31. Average OPEX Breakdown 3.3 MW turbine
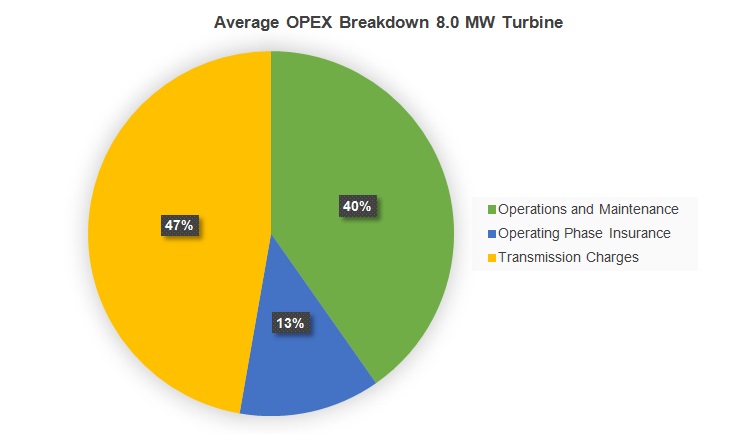
Figure 32. Average OPEX Breakdown 8.0 MW turbine
The total OPEX costs in two examined scenarios (3.3MW and 8.0MW turbines), in million £ (after discounting), is shown in the graph below (40 km from shore sites).
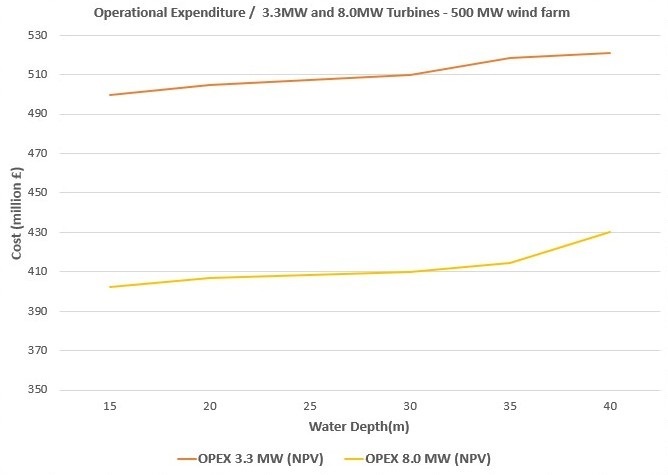
Figure 33. Total OPEX 3.3MW & 8.0MW sites
The diagram indicates that OPEX for 8.0MW turbines scenarios is lower at all the water depths. The main parameter in OPEX is the cost of maintenance, which is proportional to the number of wind turbines in a wind farm. To reach the capacity of 500MW wind farm 63 8.0MW or 152 3.3MW turbines must be used, which is the reason of the difference in OPEX in these two scenarios.
Decommissioning (DECOM)
It has been assumed that decommissioning takes place in 26th year, lasts a year and is a process reverse of the installation. No residual value or the costs of scrapping have been considered, which in different case, would further reduce LCOE. Decommissioning costs account for approximately 1.5% of the total cost.
Table 14. DECOM costs

Annual energy production (AEP)
The annual electricity production, before losses, has been calculated for each site, based on the equations derived from the VESTAS average annual production curves (Vestas Wind Systems A/S. 2013). In order to calculate the real annual production in a wind farm, it has been considered paramount to take into account a number of factors affecting the production. Factors such as aerodynamic array losses, electrical array losses, losses due to wind farm unavailability and other losses. The factors applied for each turbine are shown in the table below.
Table 15. Energy losses

Table 16. Annual Energy Production

The AEP per MW of rated power is 2-3% higher for the 8.0MW turbine when compared with the 3.3MW one, resulting in a higher absolute energy yield per MW (prior to discounting). The total discounted electricity generation (for wind farm operational life) for each site is shown in the graph below.
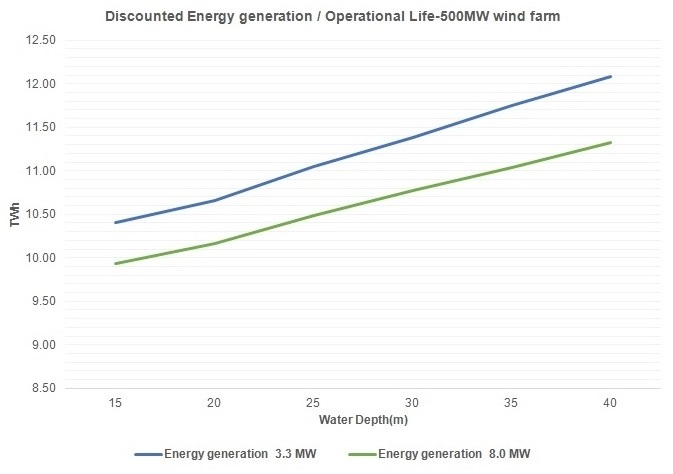
Figure 34. Discounted energy generation
Weighted average cost of capital (WACC)
Weighted average cost of capital (WACC) is a discount factor, which is determined by the capital structure and the financing costs of each project. The capital cost is a very important factor in the economic analysis of an offshore wind project, as a drop of a single point in the WACC would cause an approximate drop of 6% in the LCOE (Estate, 2011).
The WACC value is driven by the uncertainties and the risk involved in the project. Since in 3.3MW turbines scenarios proven technology has been used, these have been analysed using a WACC of 9.84 %, while the 8.0MW turbines scenarios using a higher WACC of 10.70%. The costs of financing will follow a downward trend, if only risks in the wind farm industry become better managed.
Analysis Results for 3.3 MW & 8.0 MW Turbine
The LCOE including seabed rent for the six generic sites located at a distance of 40 km to shore considered in the analysis, is demonstrated in the bar chart below:
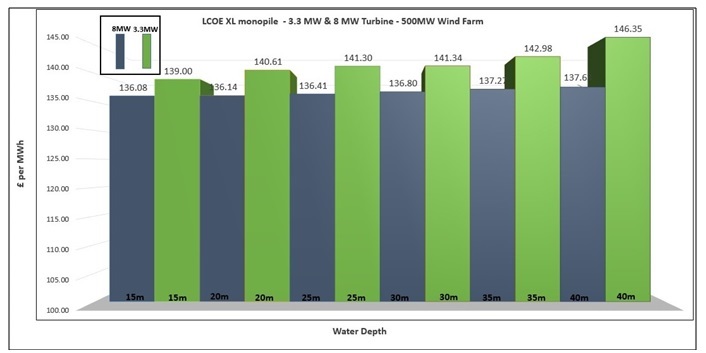
Figure 35. LCOE 3.3 MW & 8.0 MW turbine (40 km to-shore).
Table 17. LCOE including sea bed rent

Development of LCOE
Considering 3.3MW turbines scenarios at A-F sites, LCOE increases at a rate of approximately 1% every 5m of depth, while in 8.0MW turbines scenarios the rate of increase is significantly lower as it is accounted for approximately 0.02%.
At the further to shore site G, LCOE is significantly higher than at site E, which is located at the same water depth but 40 km from the shore. The increase of LCOE at the further to shore site has been attributed to the higher operational and installation costs. It is important to highlight the fact that the further to shore sites in the UK will become operational at a later stage (after 2017-2020).
The analysis has also highlighted that the usage of 8.0MW turbines supported on XL monopiles are the preferable solution in terms of cost, if compared with the 3.3MW one. The difference in LCOE between the two turbine types is highlighted in the graph below.
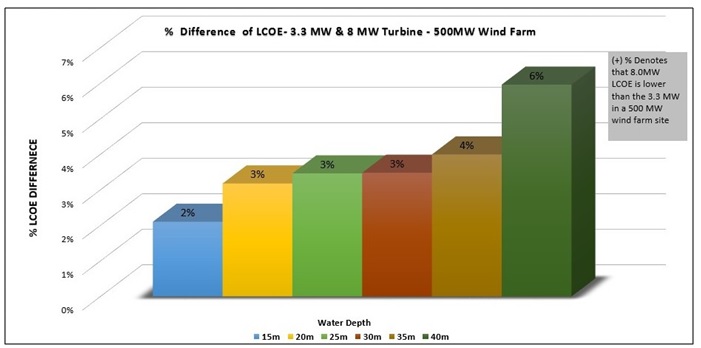
Figure 36. % saving in LCOE using 8.0 MW turbine
The LCOE saving in 8.0MW scenarios is in average 3.2% with greater saving observed at deeper waters (5.96%).The saving is directly related to the overall reduction of CAPEX due to the material saving made by employing 8.0MW turbines. In a 500MW wind farm, the above mentioned fact means less wind turbines (approximately 89 less), with the average material saving for the supporting structure (inc. tower) at 21%, as indicated in the graph below.
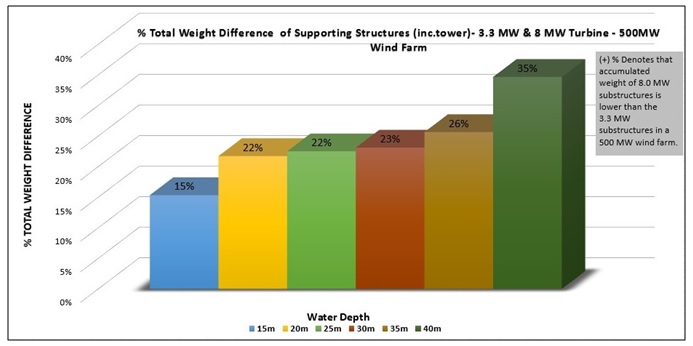
Figure 37. % SW difference of Substructure (8.0 MW-3.3 MW turbine)
The average saving considering the full operational life of the investment was approximately 124,000,000£ per site, indicating the strong need of switching to wind turbines with higher rated power.
XL Monopiles vs. Jackets
As part of this study, it has been considered important to examine alternative foundation types widely used at greater water depths, so as to assess potential financial benefits derived from the usage of XL monopiles. Data from the literature has been used in order to perform the comparative study, regarding steel jacket characteristics and weights of substructures for a variety of conditions closely matching our assumptions.
The comparative study has indicated that the usage of regular monopiles and low rate turbines offers a considerable saving in the developments up to 35m water depth in comparison to jacket foundation. A space frame substructure is a more attractive option in case of usage of low rate turbine installed at deeper waters.
The trend changes when higher rate turbines are employed. The usage of XL monopiles with high rate turbines make them an attractive solution even at water depths over 35m.
XL monopiles are an immature technology in comparison with jackets what indicates a constrained operating envelope. That will not be the case in the future as supply chain improvement and installation refinement are bound to place XL monopiles at the forefront of the deeper water foundations.