Results
All the results were obtained from analysis of data at 1 minute time steps and gives a clear picture of our 3 defined scenarios.
Annual Energy Demand and Supply
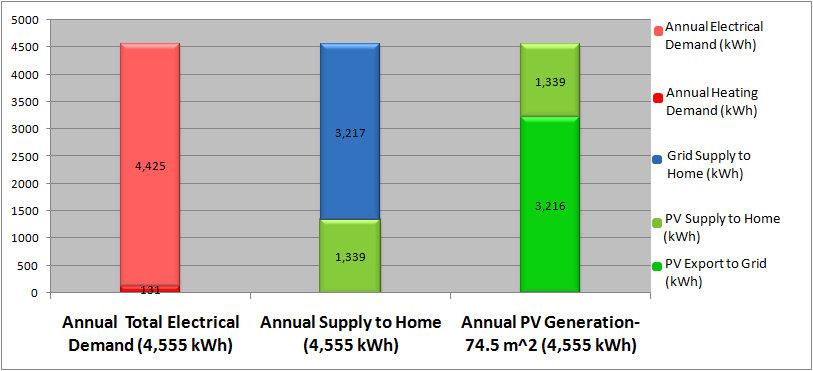
Fig. 1 shows the values of the annual energy demand and supply of the Zero Carbon Home. The heating demand is very low, compared to the electricity demand. This is the advantage and main characteristic of a passive house. The space heating demand is almost negligible and whatever heating demand exists is because of the hot water. Also, this can be varied by installing a storage tank for storage of the hot water and further reducing this demand.
Most of the energy demand during the night is met by the grid as there is no PV generation during this period. During the summer season, when the PV generation is in excess of the demand, it is exported to the grid and compensated for, whatever power is drawn from it during the night time. Therefore, the net Zero Carbon status of the home is established and is apparant from Fig 1.
Grid, PV Supply and Demand Over the Year
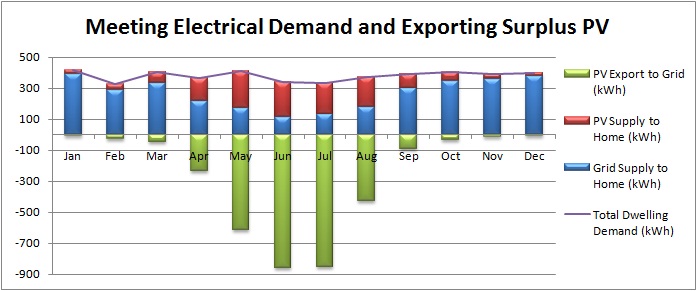
Fig.2 shows the monthly break up of PV supply to home, grid import to home and PV export to grid. It is observed that during the winter months, there is significant import of power from the grid, as there is very less PV supply. Conversely, during the summer months, there is a large amount of PV supply and therefore, the excess is exported to the grid.
The energy demand of the home is more or less constant over the whole year. This is because the home in context is a passive house and requires very less energy for space heating. Therefore, this helps in reducing the energy demand quite significantly over the whole year.
PV Used by Home and Exported to Grid
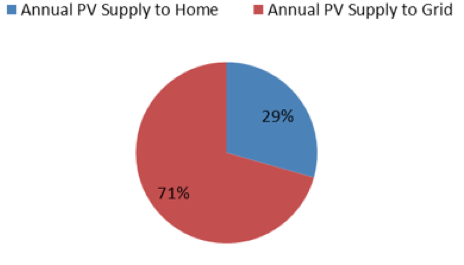
Fig.3 shows the proportions of PV power consumed by home and that exported to the grid. Whenever there is enough solar energy, the PV power generation is quite good and most of the time exceeds the power demand of the home. At this time, the excess power is exported to the grid. The total amount of PV power exported to the grid over the whole year is 71% of that which is generated.
When the PV generation is lesser than the electrical demand of the home, the entire amount is used to meet the energy demand of the dwelling. During this time, extra power is also drawn from the grid to meet the excess demand. Over the whole year, 29% of the PV power generated is used by the home to meet the electrical demands within it.
Economic Analysis
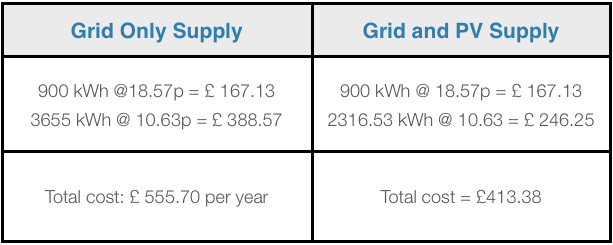
From Table 1, we observe that the householder has to pay an extra £ 142.32 per year if he/she would opt to only use electricity from grid and no PV. Therefore, the introduction of PV gives a large amount of saving on utility bills for the householder each year.
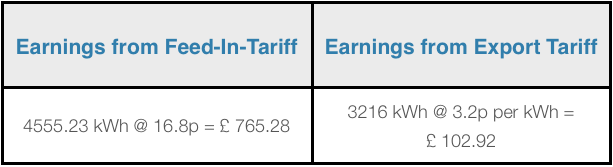
From Table 2, we observe that the householder would make a total of £ 454.82 annually, compared to £ 555.70 which he/she would have to spend if opted out of PV supply. Therefore, it can be inferred that installation of PV gives a significant amount of earnings to each household and people would earn, compared to what would be the case had they not opted for it.
Table 3: Economic Results with one day data in June
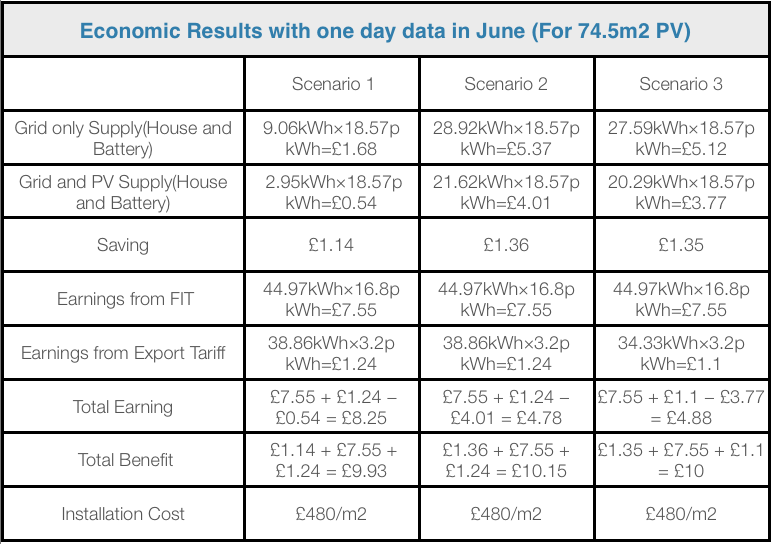
Scenario 1
If there is PV installed, it will save £1.14 in one day on grid electricity cost. Householder would make £8.25, rather than paying out £1.68.
Scenario 2
If there is PV installed, it will save £1.36 in one day on grid electricity cost. Householder would make £4.78, rather than paying out £5.37.
Scenario 3
If there is PV installed, it will save £1.35 in one day on grid electricity cost. Householder would make £4.88, rather than paying out £5.12.
Calculation of Payback period of PV Installation
Assuming installation cost of £480 per m² of PV:
Grid Savings + FIT Income + Export Tariff Income = £937.63 per year
Payback period = 38 years
Energy Demand in Scenarios 1 and 2
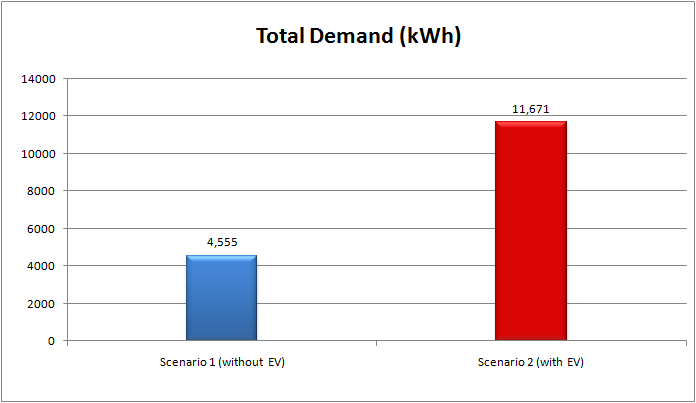
Fig. 4 shows the respective annual energy demands of the Zero Carbon Home with and without the EV integrated to it. It is observed that integration of the EV increases the energy demand annually by 2.5 times. This is due to the EV battery charging load which is introduced into the home. Therefore, the total dwelling power demand increases significantly, which causes an increase in the power drawn from the grid as well.
Effect of EV Battery on Grid Power Import
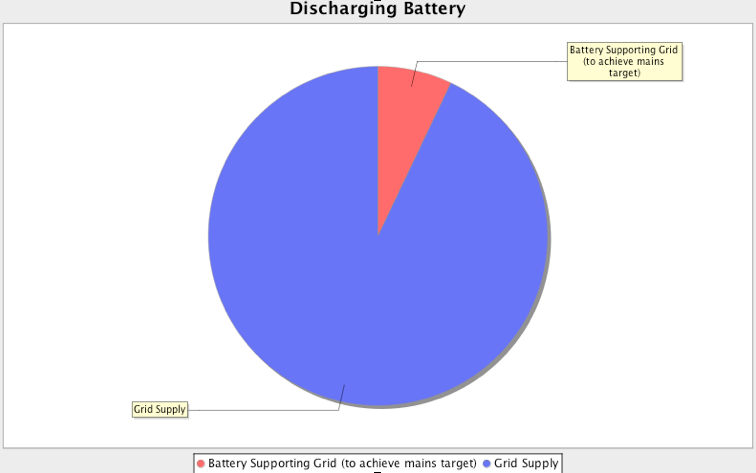
Fig. 5 and Fig. 6 show the interaction between the grid, home and battery. Fig 5. shows how the battery helps in limiting the draw of power from the grid and achieving the mains target. During this period, the demand of the house is met partially by the grid and the rest from the EV battery. Not more than 300 W of power is drawn from the grid at any moment and any demand in excess of this is met by the EV battery. This helps in reducing the utility bills of the household and also is advantageous for the DNO as they do not have to meet the sharp peaks of power demand by the dwelling.
Fig. 6 shows how the curve of electricity demand from the grid is smoothed by the EV battery. There is a constant load for charging the battery during the night and this energy is stored to discharge later during the day. In scenario 1, where there is no EV battery, we see that there are peaks in the power imported from the grid during the evening. In scenario 2, these peaks are smoothed out by discharging the EV battery during these periods and meeting electricity demand through it. Therefore, the curve in scenario 2 is rather smooth without any spikes in power demand from the grid. This clearly shows how important a role, the EV battery can play in limiting the power drawn from the grid and benefit both householders as well as DNOs.
Battery State of Charge
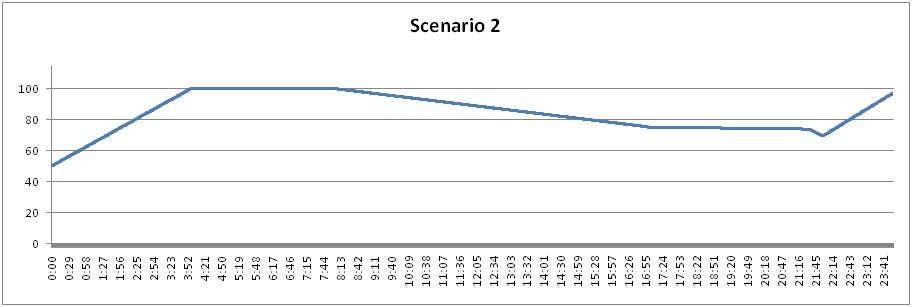
Battery State of Charge in Scenario 2
hows how the state of Charge of the EV battery varies during the whole day when the battery is supplied only from grid electricity import. This is a typical day in June, when the car left the house at 0800 hrs and returned at 1700 hrs. The SOC is 100% at 0400 hrs, when it is fully charged and remains so, till it leaves the house at 0800 hrs. The SOC is at 75% when it returns to the house at 1700 hrs. The battery further discharges to meet domestic demand till 2200 hrs, when it again starts charging. The SOC of the battery at this point is 69%. Therefore, it is observed that the SOC remains fairly high and does not go anywhere near the minimum set value of 37%.
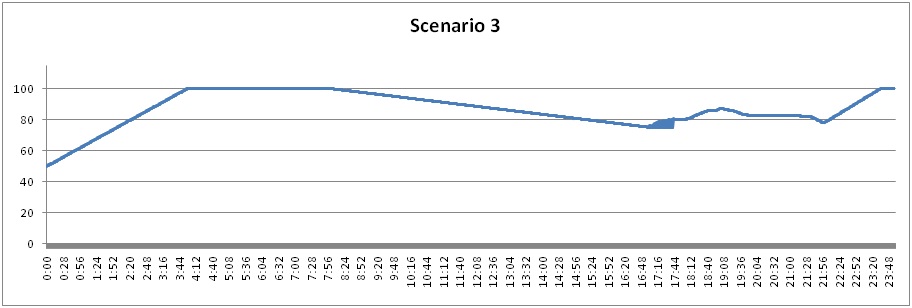
Battery State of Charge in Scenario 3
Fig 8. Shows how the state of Charge of the EV battery varies during the whole day when the battery is charged both from PV supply and grid electricity import. This is a typical day in June, when the car left the house at 0800 hrs and returned at 1700 hrs. The SOC is 100% at 0400 hrs, when it is fully charged and remains so, till it leaves the house at 0800 hrs. This is much earlier than that in scenario 2 as PV has also contributed a significant amount in the charging of the battery. This also limits the requirement for the import of electricity from the grid. The SOC is at 75% when it returns to the house at 1700 hrs. The battery further charges and also discharges, as and when required to meet domestic demand and meet the mains target till 2200 hrs, when it again starts charging. The SOC of the battery at this point is 75%. Therefore, it is observed that the SOC remains fairly high and higher than that in scenario 2 and does not go anywhere near the minimum set value of 37%.
Comparison of Charging Times
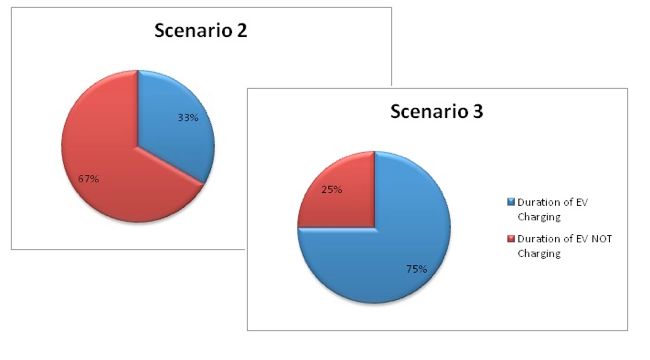
Comparison of Charge Time
Compares the amount of time in Scenarios 2 and 3 that the EV charges and does not charge.
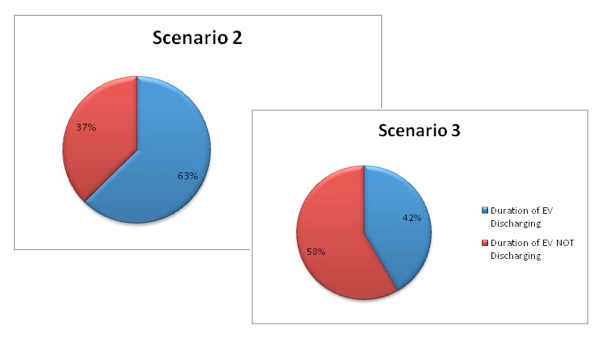
Comparison of Discharge Time
Compares the amount of time in Scenarios 2 and 3 that the EV charges and does not charge.
Comparison of Charge Time
Compares the amount of time in Scenarios 2 and 3 that the EV charges and does not charge.
Resources
Qian, K., Zhou, C., Allan, M. & Yuan, Y., May 2011. Modeling of Load Demand Due to EV Battery Charging in Distribution Systems. IEEE TRANSACTIONS ON POWER SYSTEMS, 26(2), pp.802-10.
Pecas Lopes, J.A., Soares, F.J., Almeida, P.M., Moreira da Silva, M. 2009. Smart charging strategies for electric vehicles: enhancing grid performance and maximising the use of variable renewable energy resources. International Battery, Hybrid and Fuel Cell Electric Vehicle Symposium. Stavanger, Norway, May 13-16, 2009.